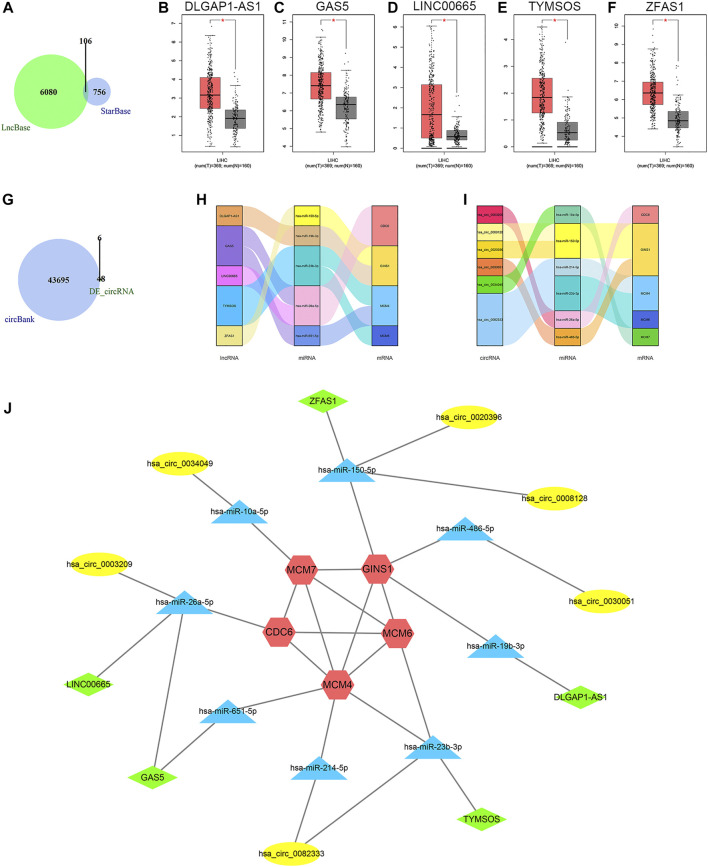
FIGURE 7.
Results of ceRNA prediction and ceRNA network construction. (A) Venn diagram of the common predicted lncRNAs. (B−F) Differential expression analysis of the lncRNAs in GEPIA. Tumor tissue is shown in red, and normal tissue is shown in gray. (G) Venn diagram of the predicted circRNAs and differentially expressed circRNAs. Sankey diagrams of the lncRNA-miRNA-mRNA regulatory relationship (H) and circRNA-miRNA-mRNA regulatory relationship (I). (J) The ceRNA network. Red represents the mRNAs, blue represents the miRNAs, green represents the lncRNAs, and yellow represents the circRNAs. CeRNA, competing endogenous RNA; lncRNA, long non-coding RNA; GEPIA, Gene Expression Profiling Interactive Analysis; circRNA, circular RNA; miRNA, microRNA; mRNA, messenger RNA; LIHC, liver hepatocellular carcinoma; T, tumor; N, normal; DE_circRNA, differentially expressed circular RNA.

