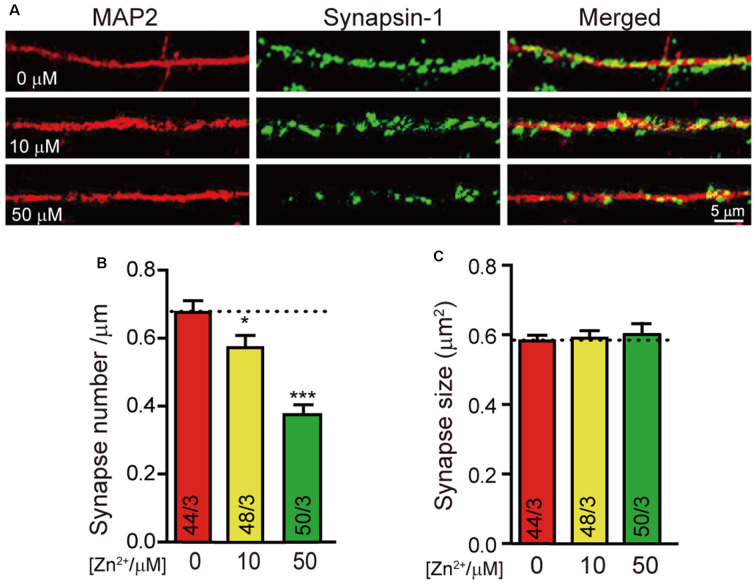
Figure 1.
Higher concentration of Zn2+ decreases the synapse formation of cultured neurons. (A) Representative images of neurons cultured with 0 μM/10 μM/50 μM Zn2+ were fixed and labeled by synapsin1 (to mark synapses) and MAP2 antibodies (to mark dendrites). The scale bar in the right lower corner applies to all images. (B,C) Summary graphs of synapse number (the number of synapsin1-specific puncta) and synapse size (the area of synapsin1-specific puncta) for all conditions as described in (A). Data information: numbers of cells/independent cultures analyzed are listed in the bars. Data shown in summary graphs are mean values ± SEM. Statistical significance was analyzed by Student’s t-test. *p < 0.05; ***p < 0.001. Scale bar: 5 μm.

