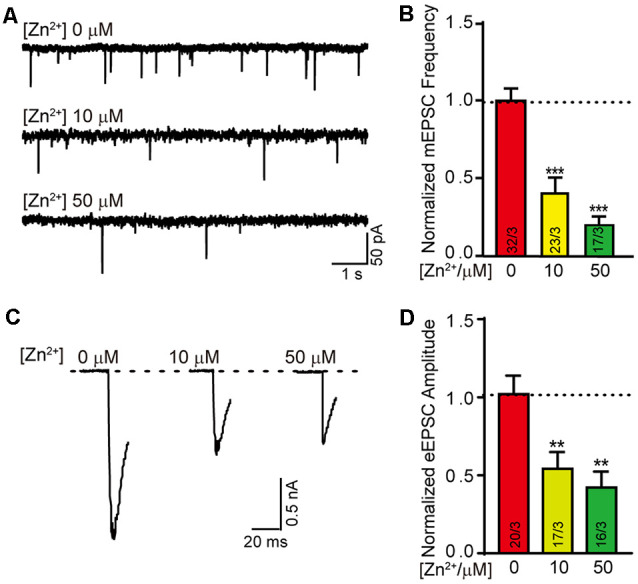
Figure 2.

Higher concentration of Zn2+ damages the excitatory synaptic transmission. (A) Sample traces of mEPSCs recorded in cortical neurons cultured with 0 μM/10 μM/50 μM Zn2+. (B) Summary graphs of the normalized frequency of mEPSCs for all conditions as described for (A). (C) Sample trace of action potential eEPSCs recorded from cortical neurons cultured with 0 μM/10 μM/50 μM Zn2+. (D) Summary graphs of the normalized amplitude of eEPSCs recorded in the neurons described in panel (C). Data information: numbers of cells/independent cultures analyzed are listed in the bars. Data shown in summary graphs are mean values ± SEM. Statistical significance was analyzed by Student’s t-test. **p < 0.01; ***p < 0.001.
