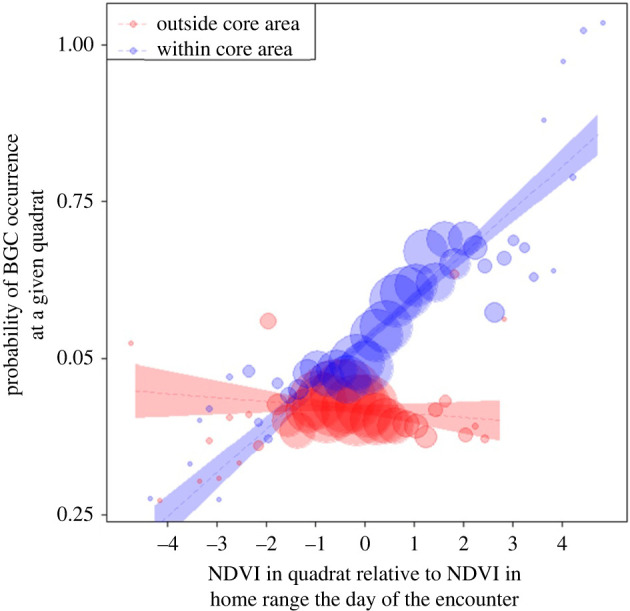
Figure 3.

Differences in the probability of BGC in a given quadrat as subject to the mean NDVI in quadrat relative to the mean NDVI in home range during the encounter day. The dashed lines represent the fitted model (with all other predictors being centred), dots represent the averaged probability of having an encounter, and their area corresponds to the number of encounters in the respective quadrat (n = 1 to 25 per bin). Shaded areas represent 95% confidence intervals of the fitted models.
