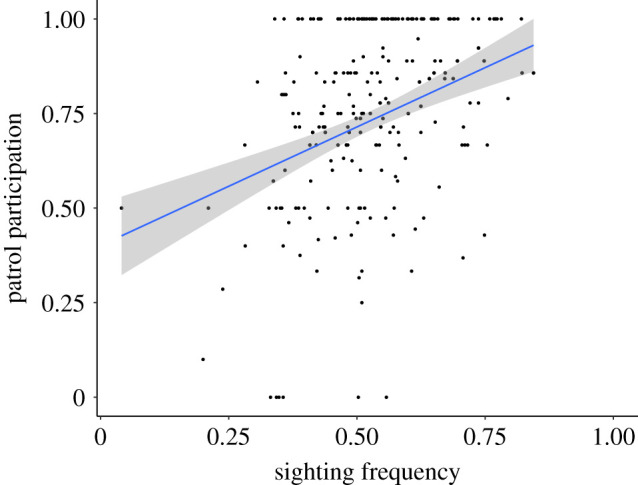
Figure 2.

Boundary patrol participation versus sighting frequency. Each point represents the percentage of patrols in which a male participated for a given year. Plotted regression line represents the probability of a male participating in a given patrol relative to annual sighting frequency. The grey area represents the 95% confidence interval for the regression line. (Online version in colour.)
