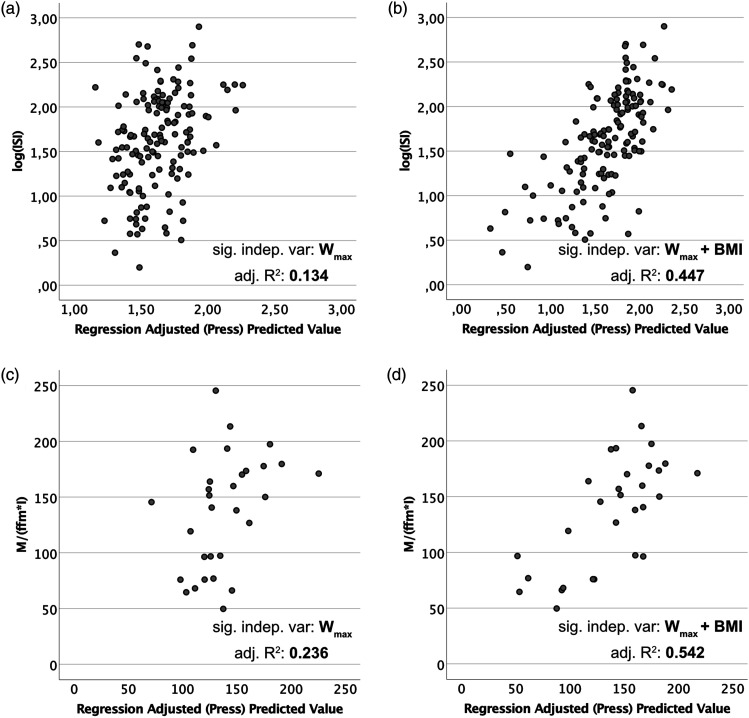
Figure 1.
Graphical representation of the most important linear regression models from Tables 2 and 3. The dependent variables are displayed on the y-axes. In addition to the significant independent variables listed in the graphs, the models underlying A. and C. also included time after delivery and age, B. and D. time after delivery, age and height.

