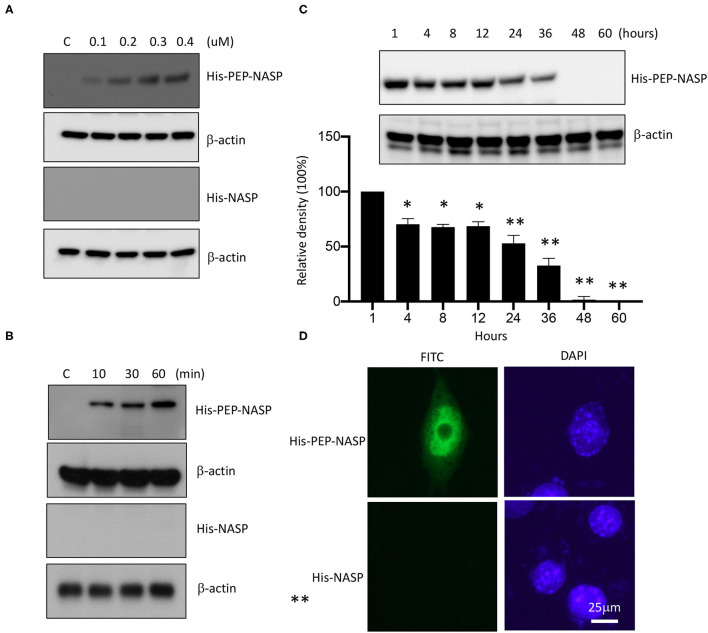
Figure 2.
Transduction of the PEP-NASP into RAW 264.7 cells. Cells were cultured in 60-mm culture dishes. Then, PEP-NASP (0.1 ~ 0.4 μM) and control NASP were added to the culture media for 1 h (A), and PEP-NASP (0.4 μM) and control NASP were added to the culture media for 10 ~ 60 min (B), and analyzed by immunoblotting (IB) with an antibody against His or β-actin. Transduction of PEP-NASP stability was assessed after various time periods (1 ~ 60 h). Cells pretreated with 0.4 μM PEP-NASP for 1 h and analyzed by IB with an antibody against His or β-actin (C). The intracellular distribution of the transduced PEP-NASP and NASP was observed by confocal microscopy (D). Scale bar = 25 μm. Data represent a minimum of three independent experiments.

