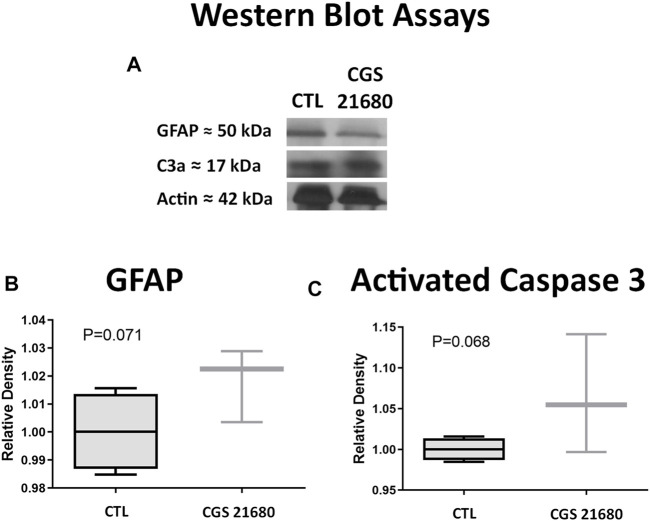
FIGURE 2.
(A) Western blots of retinas from CGS21680-treated and CTL eyes and their quantifications. From top to bottom, bands correspond to GFAP, activated Caspase-3, and actin. (B) Quantification of GFAP by WB. (C) Quantification of activated caspase-3 by WB. Relative densities were normalized against CTL β-actin. Boxes represent 25 and 75 percentiles, whiskers represent minimum and maximum values, and transverse lines represent medians. No statistical differences were found between groups.

