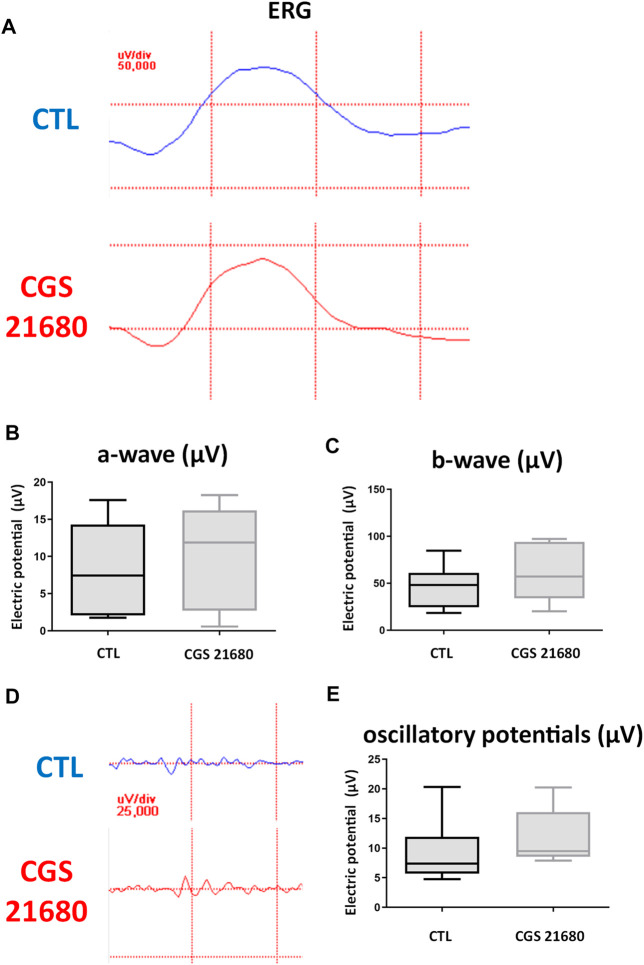
FIGURE 3.
ERG recordings of control eyes (CTL) and CGS21680-treated eyes. (A) ERG recording a CTL eye (above) and a CGS21680-treated eye (below) 1 week after CI. (B) Quantification of a-wave. (C) Quantification of b-wave. (D) Response of oscillatory potentials 1 week after exposure to CI of a CTL eye (above) and an eye treated with CGS21680 (below). (E) Quantifications of OP. Boxes represent 25 and 75 percentiles, whiskers represent minimum and maximum values, and transverse lines represent medians. No statistical differences were found between groups.

