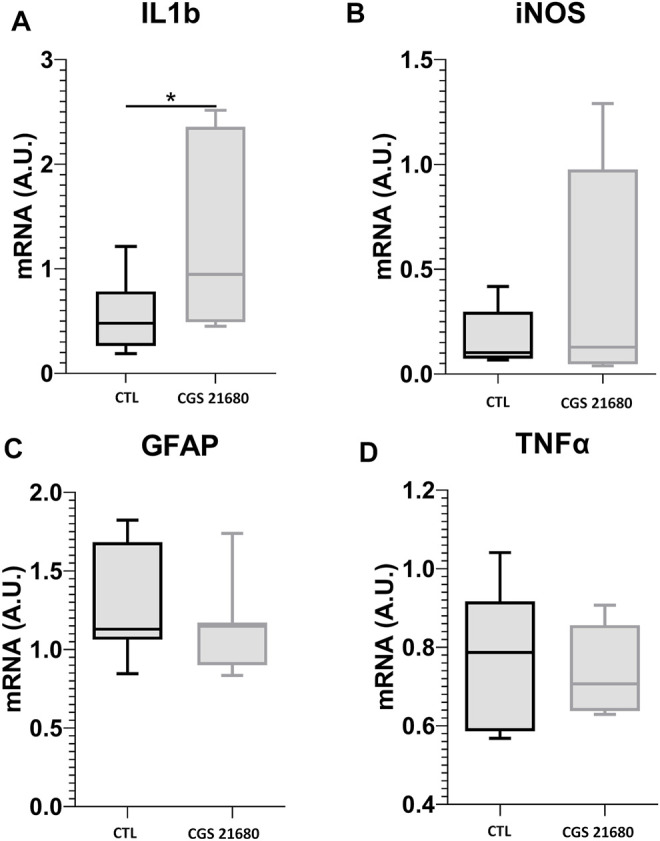
FIGURE 4.

qRT-PCR for IL-1β (A), iNOS (B), GFAP (C), and TNF-α (D) mRNAs in retinas from CGS21680 and their respective CTL. Boxes represent 25 and 75 percentiles, whiskers represent minimum and maximum values, and transverse lines represent medians (Student’s t-test, *p < 0.05).
