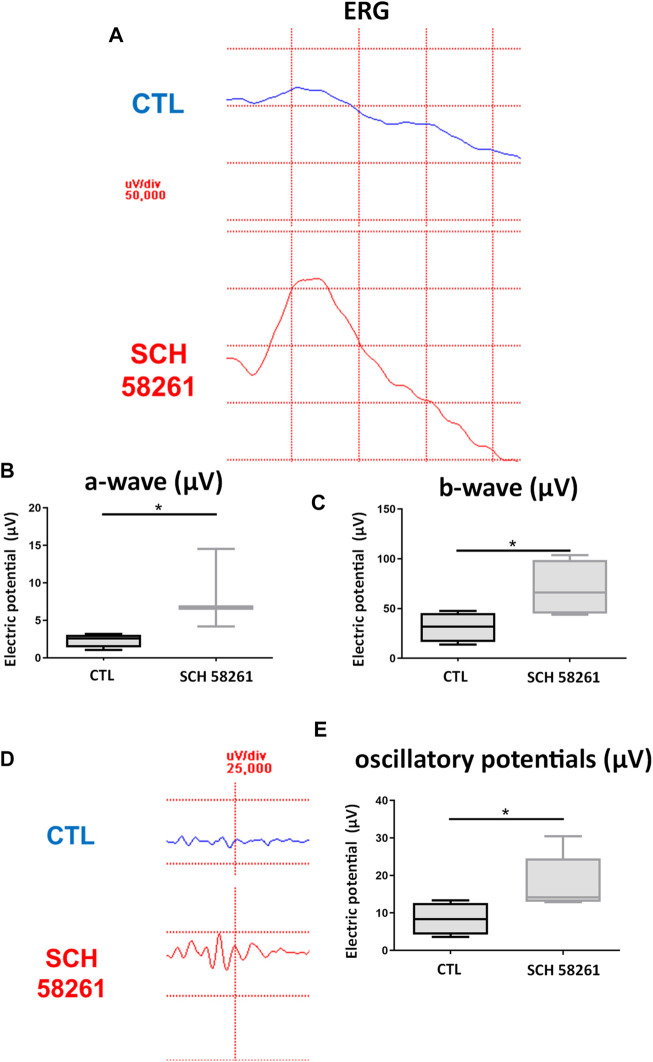
FIGURE 7.
Effect of treatment with SCH58261 on ERG recordings post CI. (A) ERG recording 1 week after exposure to 24 h of CI of a CTL eye (above) and an SCH58261-treated eye (below). (B) Quantification of a-wave. (C) Quantification of b-wave. (D) Response of oscillatory potentials 1 week after 24 h of CI of a CTL eye (above) and an SCH58261-treated eye (below). (E) Quantification of OP. Boxes represent 25 and 75 percentiles, whiskers represent minimum and maximum values, and transverse lines represent medians. Student’s t-test,*p < 0.05.

