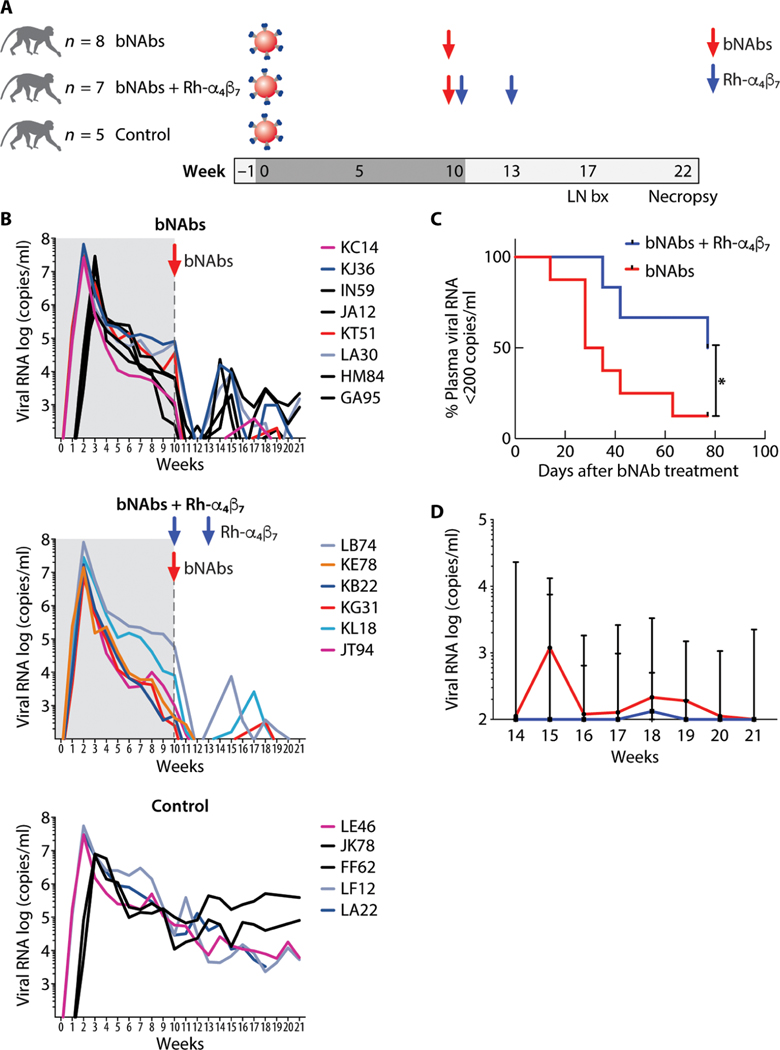
Fig. 1. Anti–HIV bNAbs and Rh-α4β7 mAb combined treatment delays rebound viremia in SHIV-infected macaques.
(A) Shown is a schematic of the study design (LN bx, lymph node biopsy). (B) Log viral RNA (copies/ml) in plasma of macaques from the time of SHIV infection and after antibody treatment is shown (black lines, intravaginal infection; colored lines, intravenous infection). The time before the bNAb infusion is shaded in gray. The top graph shows the pVLs in the bNAbs-only group; the middle graph shows the VLs in the bNAbs–Rh-α4β7 combined treatment group, and the bottom graph shows the VLs in control, untreated animals. (C) Kaplan-Meier curves were generated for time to first detection of plasma viral RNA >200 copies/ml in the bNAbs-only group and bNAbs–Rh-α4β7 group. Curves are compared with the Gehan-Breslow-Wilcoxon test (P = 0.042). (D) Shown is the median ± range of log viral RNA (copies/ml) in plasma after week 14 p.i. (earliest time of pVL rebound) for the animals in the two treatment groups.

