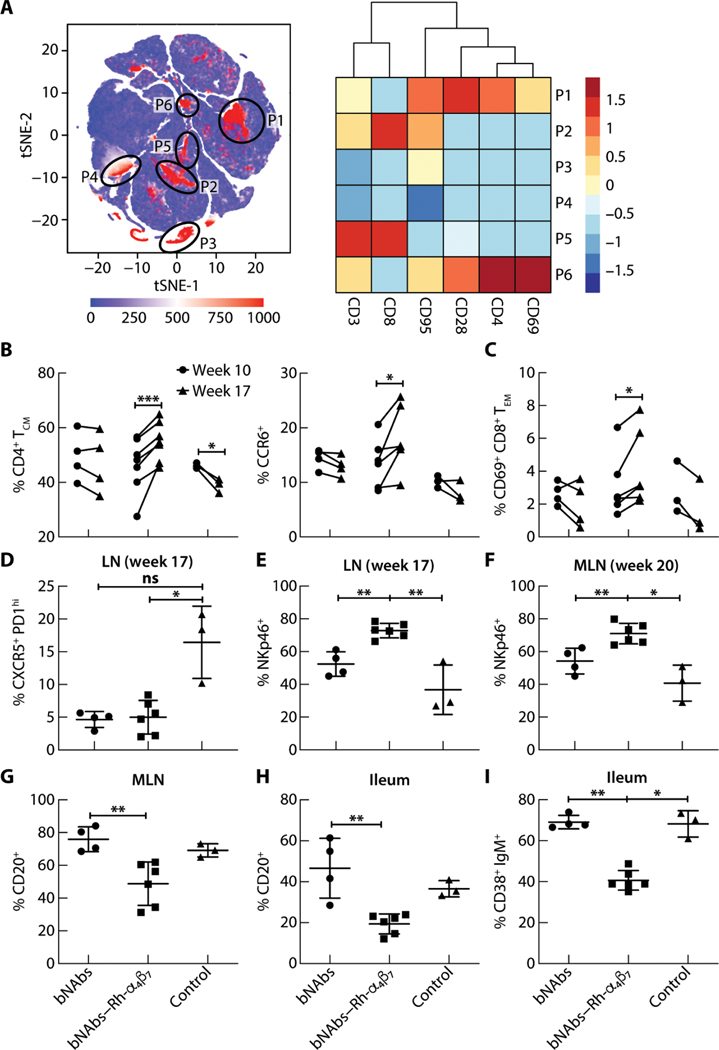
Fig. 4. Effects of bNAbs–Rh-α4β7 treatment of SHIV-infected macaques on T cells, NK cells, and B cells in different tissues.
(A) Left: tSNE plot displaying kinetics of expression of α4β7 on live single-cell populations in blood from SHIV-infected macaques, including four animals from the bNAbs-only group, six from the bNAbs–Rh-α4β7 group, and three controls. Gating of α4β7-positive cell populations on the tSNE plot was based on antigen expression and discrete density clustering. P1 to P6 (red areas in black circles) on the tSNE plot indicate the different immune cell populations expressing α4β7. Right: Heatmap depicting the fold change in expression of the antigens CD3, CD8, CD95, CD28, CD4, and CD69 for each of the immune cell populations in P1 to P6 compared to the channel values for cell populations negative for these antigens. (B and C) Shown are the frequencies of cell subsets within the CD3+ CD4+ T cell population [CD4+ central memory T cells (CM), CCR6+] (B) and the CD3+ CD8+ T cell population [CD69+CD8+ effector memory T cells (EM)] (C) among live cells isolated from PBMCs at weeks 10 and 17 p.i. Data are compared by two-way ANOVA with Bonferroni multiple comparisons correction. (D and E) Shown is the frequency of CXCR5+ PD1high T follicular helper cells within the CD3+ CD4+ T cell population (D) and NKp46+ cells within the NKG2A+ CD3− cell population (E) among live cells isolated from LN bx at weeks 17 or 20 p.i. (F and G) Shown are frequencies of NKp46+ cells (F) within the NKG2A+ CD3− cell population and CD20+ B cells (G) among live cells isolated from MLN at necropsy. (H and I) Shown are frequencies of total CD20+ B cells and CD38+ IgM+ B cells isolated from a small portion of macaque ileum at necropsy. Data from the bNAbs-only and bNAbs–Rh-α4β7 treatment groups were compared directly with a Mann-Whitney nonparametric unpaired test and were compared with the control group using the Kruskal-Wallis test and the results of the Dunn’s multiple comparisons post hoc test. *P < 0.05, **P < 0.01, and ***P < 0.001. Bars represent means ± SD.

