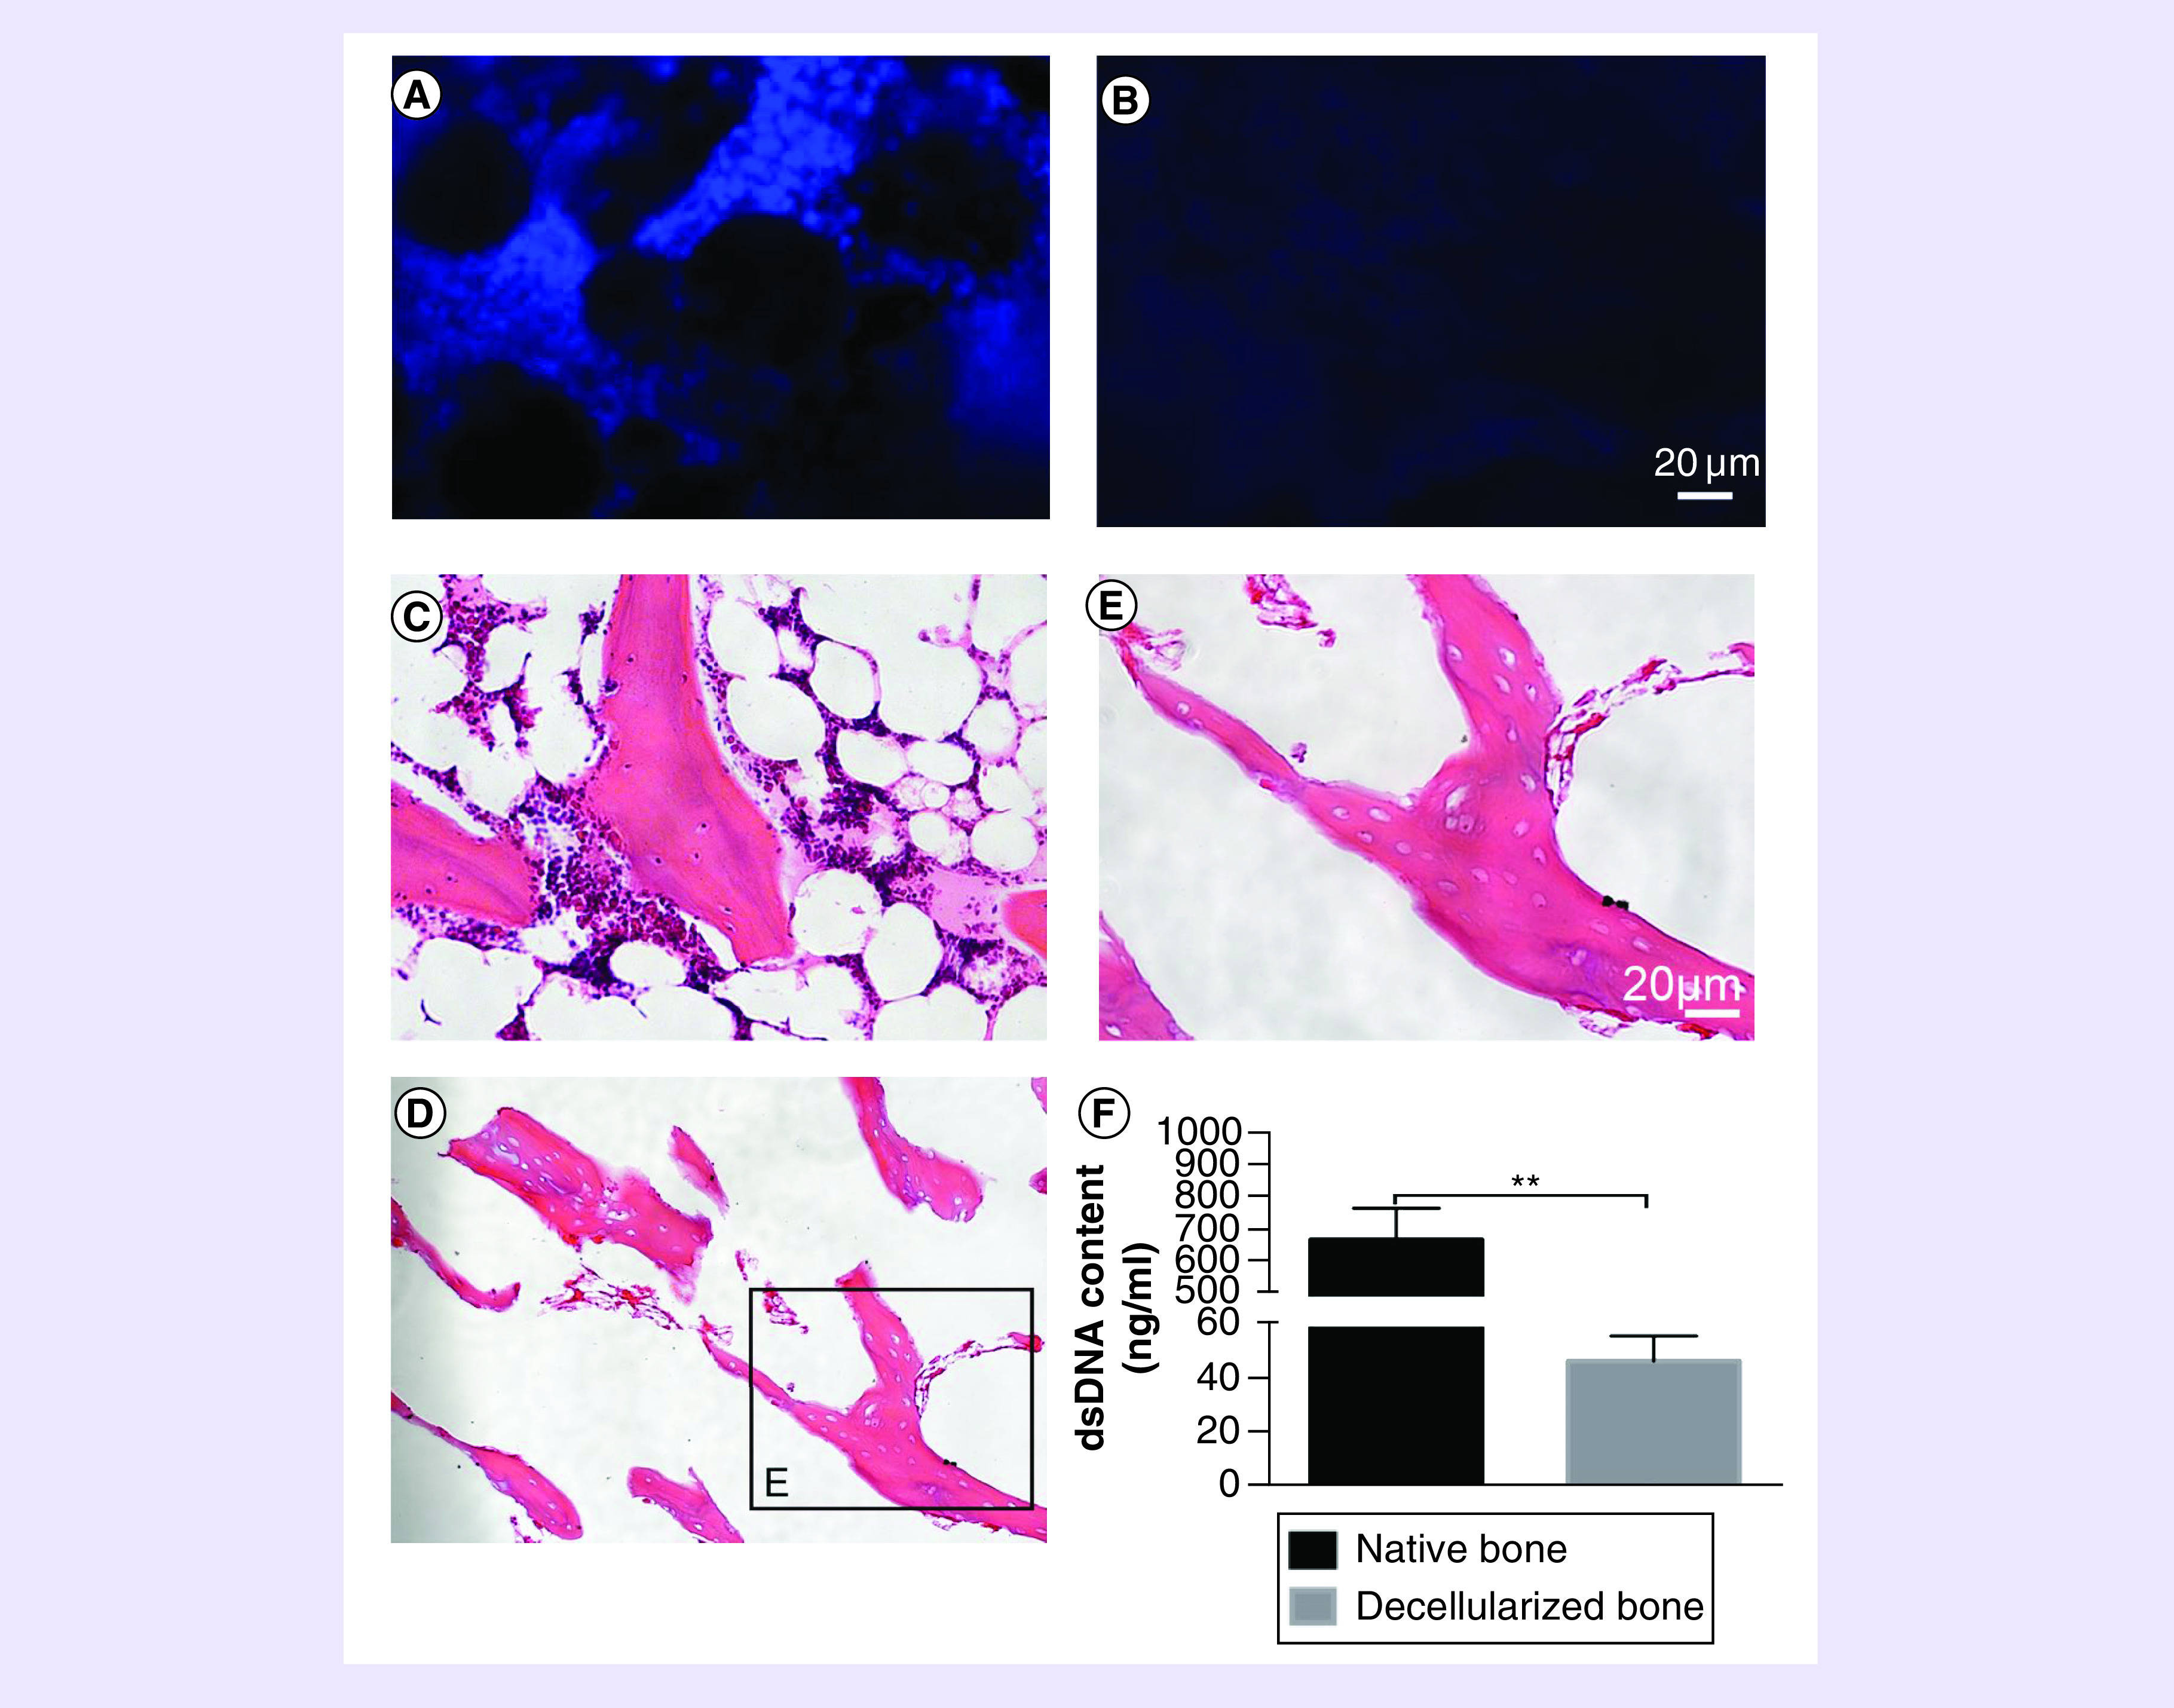
Figure 2. . Histological analysis and dsDNA quantification.

(A) DAPI staining shows native bone matrix has a large number of cell nucleus. (B) After decellularization, few cell nuclei were observed on decellularized bone matrix. (C) H&E staining shows a lot of cells around and inside native bone matrix but few cells on decellularized bone matrix were seen (D, E). (F) DNA quantification shows the dsDNA contents of native bone and decellularized bone matrix after decellularization. N = 3, mean ± standard deviation. **p < 0.05. The error bars represent standard deviation.
DAPI: 4′,6-diamidino-2-phenylindole; H&E: Hematoxylin & eosin staining.
