
Figure 3.
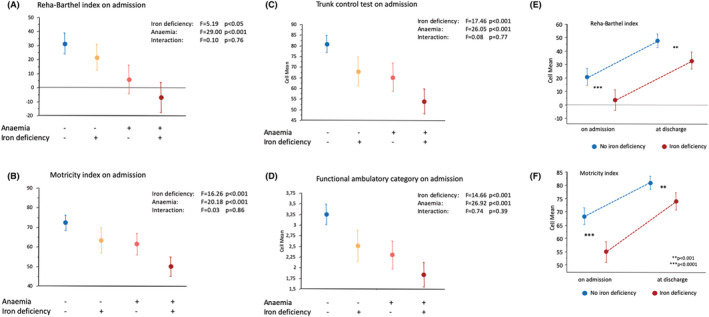
(A–D) Functional capacity assessed by reha‐Barthel index (A), motricity index (B), trunk control test (C) and functional ambulatory category (D) in patients after acute stroke (mean values ± 95% CI) with vs. without anaemia and with vs. without iron deficiency. (E–F) Change of functional capacity assessed by reha‐Barthel index (E) and motricity index (D) in patients during rehabilitation after acute stroke with vs. without iron deficiency (mean values ± 95% CI). P‐values between groups at each time point.