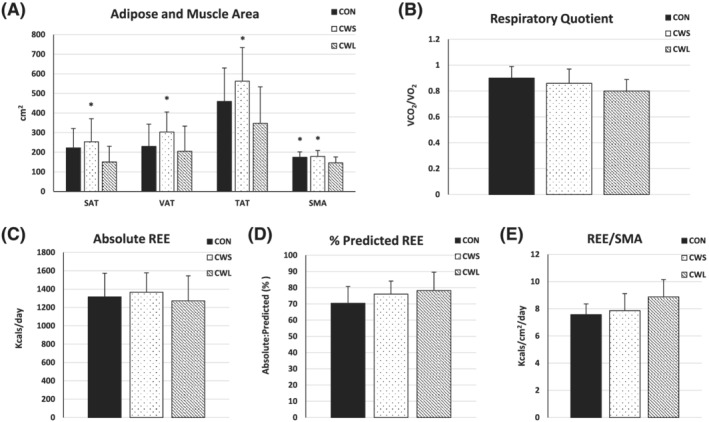
Figure 1.

(A–E) Abdominal tissue area and energy expenditure. Means and standard deviations of computed tomography‐derived adipose and muscle cross‐sectional area and energy expenditure. One‐way ANOVA comparison of (A) adipose tissue (AT) area for subcutaneous (SAT), visceral (VAT), and total (TAT) depots and skeletal muscle area (SMA) (CON, N = 17–18; CWS, N = 24–27; CWL, N = 17–22); (B) respiratory quotient (RQ); (C) absolute resting energy expenditure (REE); (D) %predicted REE (B–D): (CON, N = 11; CWS, N = 16; CWL, N = 10); and (E) REE corrected for SMA (CON, N = 7; CWS, N = 10; CWL, N = 7) between cancer patients with weight loss (CWL) or without weight loss (CWS) and non‐cancer patients (CON). *vs CWL, p < 0.05.
