
Figure 2.
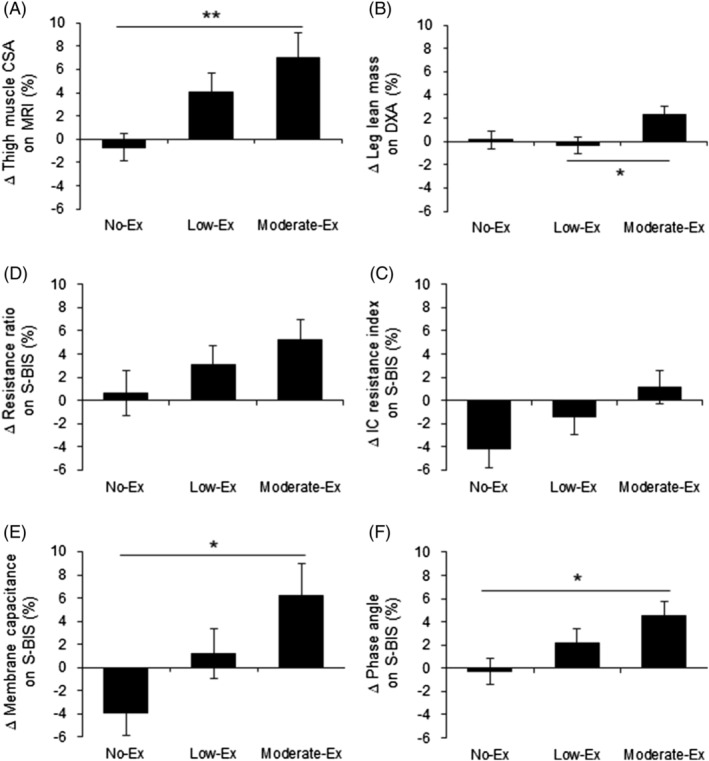
Change rates of muscle quantity and quality during the 24 week intervention. The change rates at 24 weeks from 0 weeks in muscle quantity [thigh muscle CSA on MRI (A), leg lean mass on DXA (B) and the intracellular resistance index on S‐BIS (C)] and in muscle quality [resistance ratio of intracellular to extracellular fluid (D), membrane capacitance (E), and phase angle (F)] are presented. Values are expressed as mean ± standard error. *P < 0.05 and **P < 0.01 compared among the groups (Tukey's test). CSA, cross‐sectional area; DXA, dual‐energy X‐ray absorptiometry; IC, intracellular; MRI, magnetic resonance imaging; S‐BIS, segmental bioelectrical impedance spectroscopy; resistance ratio, resistance ratio of intracellular to extracellular fluid.