
Figure 4.
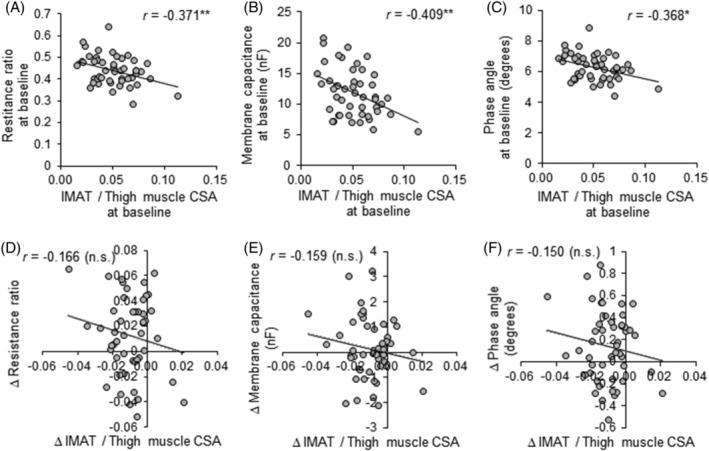
Relationships between the ratio of IMAT to thigh muscle CSA and electrical properties on S‐BIS. Pearson's correlation coefficient (r) values between the ratio of IMAT to thigh muscle CSA on MRI and the resistance ratio of intracellular to extracellular fluid (A, E), membrane capacitance (B, F), and phase angle (C, G) on S‐BIS at baseline, and the changes during the 24 week intervention. *P < 0.05 and **P < 0.01. IMAT, intermuscular adipose tissue; CSA, cross‐sectional area; n.s., not significant; resistance ratio, resistance ratio of intracellular to extracellular fluid; S‐BIS, segmental bioelectrical impedance spectroscopy.