
Figure 1.
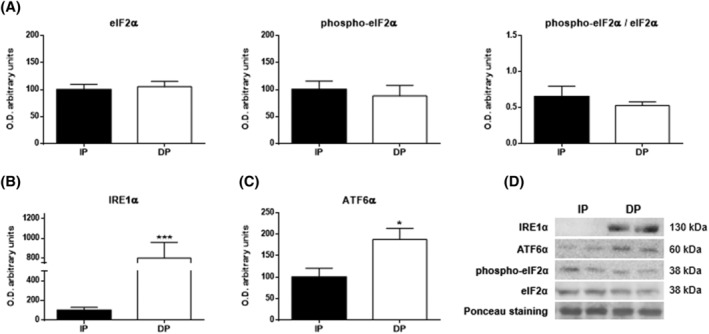
Endoplasmic reticulum stress in the muscle tissues of functional‐independent patients (IP) and functional‐dependent patients (DP). Bar chart shows the quantification of the optical densities (O.D.) of blot bands of (A) eukaryotic initiation factor 2α (eIF2α), phospho‐eIF2α, phospho‐eIF2α/eIF2α, (B) inositol‐requiring enzyme 1α (IRE1α), and (C) activating transcription factor 6α (ATF6α). (D) Representative immunoblots. Ponceau staining was used as a loading control. Data are represented as the mean ± SEM. *P < 0.05; ***P < 0.001.