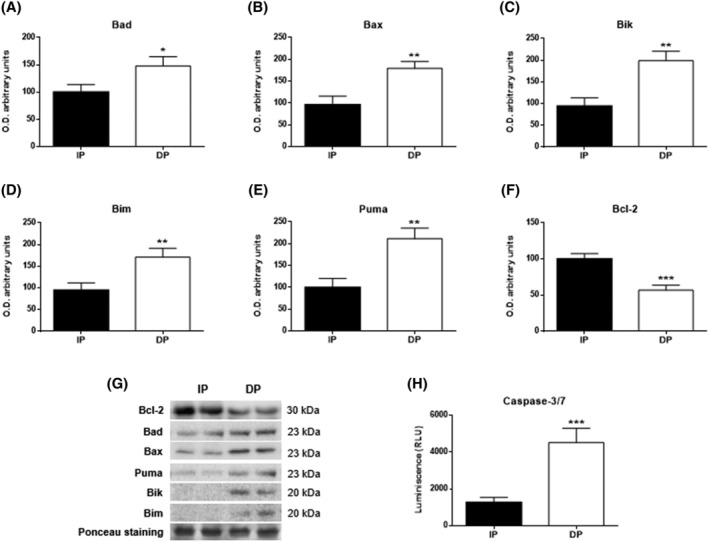
Figure 6.

Apoptosis in muscle tissues of functional‐independent patients (IP) and functional‐dependent patients (DP). Bar chart shows the quantification of the optical densities (O.D.) of blot bands for (A) bad, (B) Bax, (C) Bik, (D) Bim, (E) Puma, and (F) Bcl‐2. (G) Representative immunoblots. (H) Caspase‐3/7 was evaluated by bioluminescence. Ponceau staining was used as a loading control. Data are represented as the mean ± SEM. *P < 0.05; **P < 0.01; ***P < 0.001.
