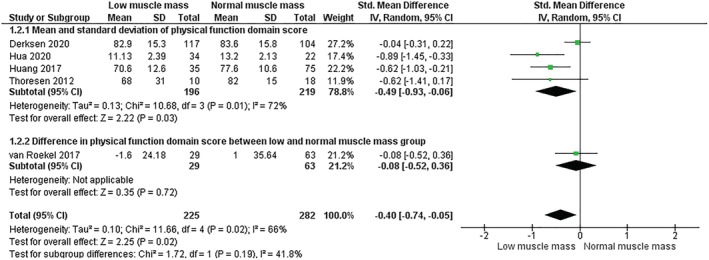
Figure 3.

Meta‐analysis of HRQOL physical function domain scores, with participants grouped according to low or normal skeletal muscle mass stores. The four studies in first subgroup reported only univariate data without adjustment for confounding factors. The study in the second subgroup reported multivariate data. Cross‐sectional area of skeletal muscle was measured at the third lumbar vertebra (L3) in all studies excluding Hua et al., 44 where L3 measurements were imputed from analysis of imaging at the third cervical vertebra (C3). As the choice of cut point used to detect low or normal muscle mass affects the classification of participants, a second forest plot was generated to demonstrate the pooled results of studies grouped by cut point, presented in Appendix S2. ‘Total’ refers to sample size of low or normal skeletal muscle mass groups in each study.
