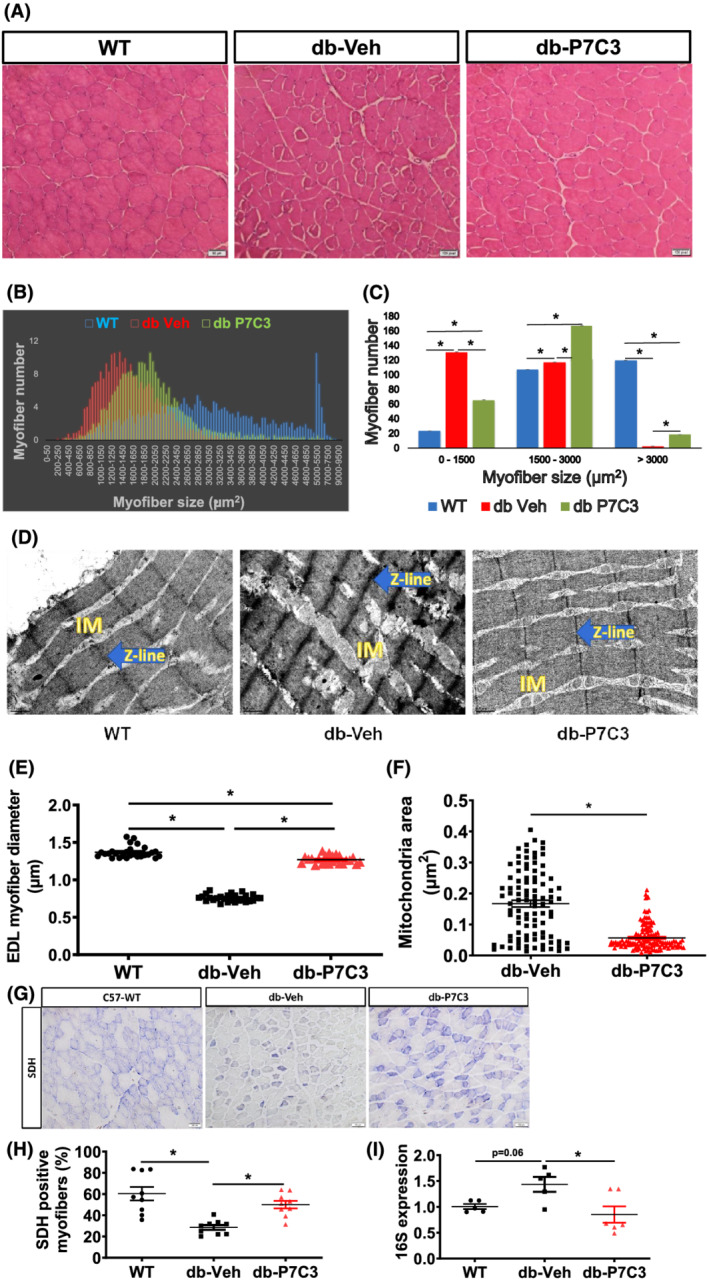
Figure 4.

P7C3 ameliorates the diabetic skeletal muscle phenotype of the db/db mice. (A) Haematoxylin and eosin stained ×20 magnification images of the tibialis anterior muscles of the diabetic mice treated with vehicle or P7C3 and the wild‐type naïve control mice. (B,C) analysis of 250 random myofibres cross‐sectional area of the haematoxylin and eosin‐stained images per section and 3 such section was counted per mice, where n = 3 mice per group displaying a shift towards medium‐sized myofibres in the db‐P7C3 treated mice (green) compared to db‐Veh treated mice (red). The age‐matched WT naïve control mice myofibres display an increased larger sized myofibres (blue). (D) Transmission electron microscopy images of the extensor digitorum longus muscle of the WT naïve control, db‐Veh and db‐P7C3 treated mice. The intermyofibrillar mitochondria (IM), and the Z‐lines (blue arrows) are distinguished in the TEM images taken at ×30 000 magnification. (E) Analysis of the extensor digitorum longus muscles myofibre diameter of TEM images at ×30 000 magnifications (n = 8–9 myofibres per image, and 3 such images were analysed per group). Data are expressed as mean ± SEM; *P < 0.05. (F) Mitochondrial area measured from db‐Veh or db‐P7C3 expressed as μm2. (G) Succinate dehydrogenase (SDH) staining of TA muscle, (H) quantification of SDH stained myofibres, and (I) relative mRNA expression of 16S in wild‐type (WT), db‐Veh, and db‐P7C3. Data are expressed as mean ± SEM, P < 0.05.
