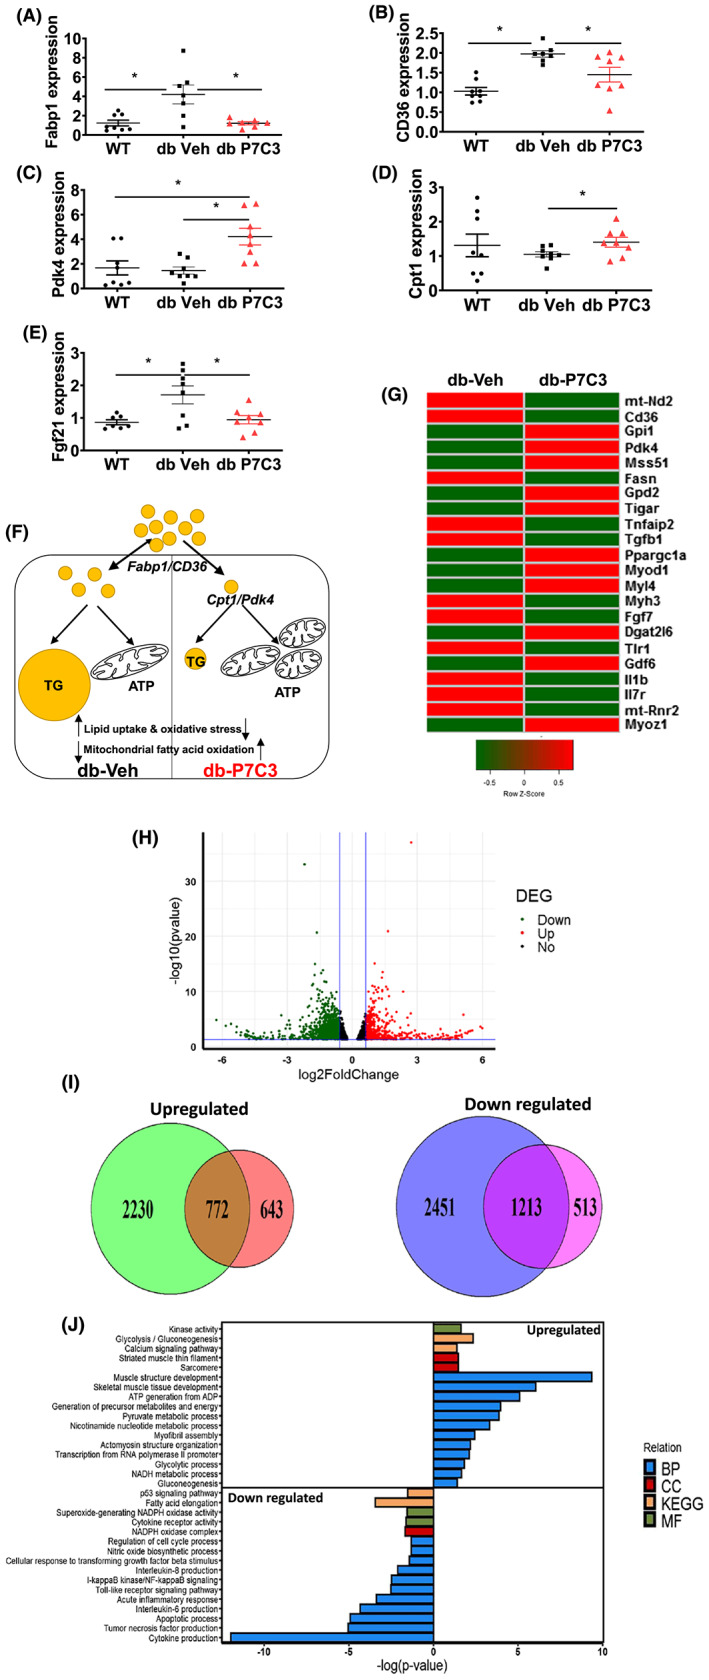
Figure 6.

P7C3 treatment increases fatty acid oxidation and decrease myofibre stress in db/db mice. Relative mRNA expression levels of (A) Fabp1, (B) CD36, (C) Pdk4, (D) Cpt1, (E) Fgf21, and (F) schematic depiction of differential gene responses in db‐P7C3 and db‐Veh showing increased mitochondrial fatty acid oxidation and decreased fatty acid uptake and oxidative stress with P7C3 treatment in diabetic mice (G) RNA‐seq analysis of skeletal muscle from db‐Veh and db‐P7C3 (H) volcano plot showing differentially expressed genes (DEG) in db_P7C3‐db_Veh. The up‐regulated genes (red), and the down‐regulated genes (green) with a fold change <0.6, and with P < 0.05 (I) Venn diagram showing comparison of the differentially up‐regulated genes in db_P7C3‐db_Veh and down‐regulated genes in db_Veh‐WT_Veh, and provides the P7C3 treatment responsive genes with 772 genes up‐regulated and 1213 genes down‐regulated, respectively (J) the top 17 up‐regulated and 16 down‐regulated pathways in the biological processes (BPs), chemical component (CC), Kyoto encyclopaedia of genes and genomes (KEGG) and molecular function (MF) pathways. Data expressed is mean ± SEM, *P < 0.05. The age‐matched WT mice was used as naïve control to determine the baseline expression levels of the key genes involved in fatty acid uptake, oxidation, and oxidative stress in gastrocnemius muscle.
