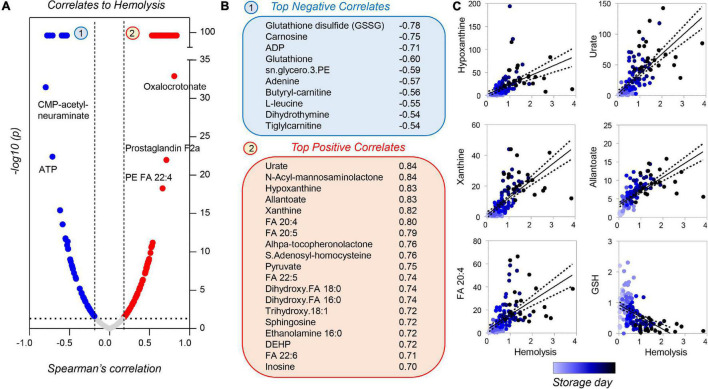
FIGURE 10.
Metabolic correlates to hemolysis for stored guinea pig RBCs. Volcano plots in panel (A) indicate Spearman correlation (x-axis) and significance [–log10(p-value) on the y-axis]. A subset of metabolites was strongly correlated [arbitrary –log10(p) = 99], either negatively (blue) or positively (red) to storage hemolysis (B). A subset of these metabolites is shown in panel (C) (color coded from light to dark blue as a function of storage duration).

