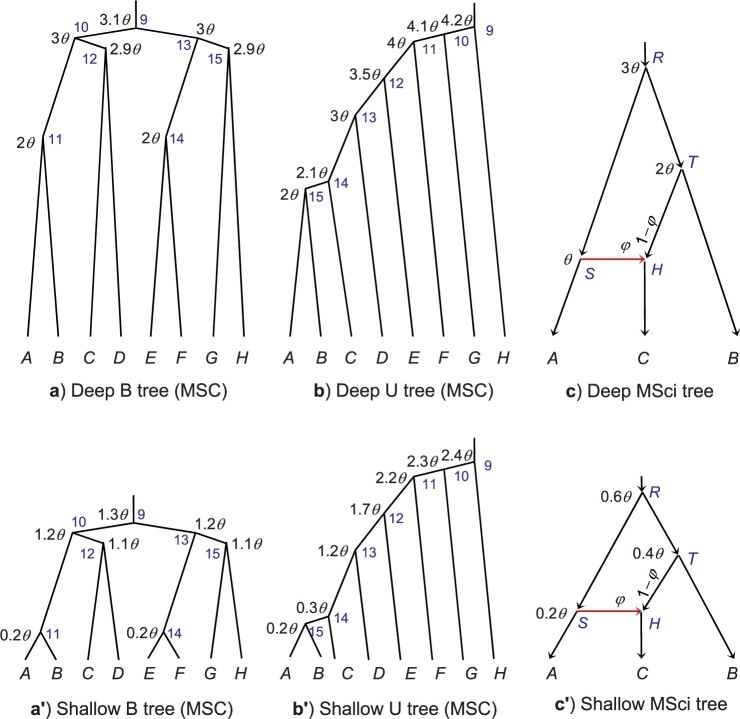
Figure 2.
(a and a ) Deep and shallow balanced species
trees and b and b
 ) deep and shallow unbalanced
species trees for eight species used for simulating data under the MSC model. c and
c
 ) Deep and shallow species trees
with introgression used to simulate data under the MSci model. The ages of internal
nodes (
 s) are shown next to the nodes,
with
  = 0.01 (high rate) or 0.001
(low rate). The blue indexes at internal nodes of the tree are used to identify the
parameters associated with the ancestral species (e.g.,
  is the age of the root and
 is the population size for
the root population in a and b).

