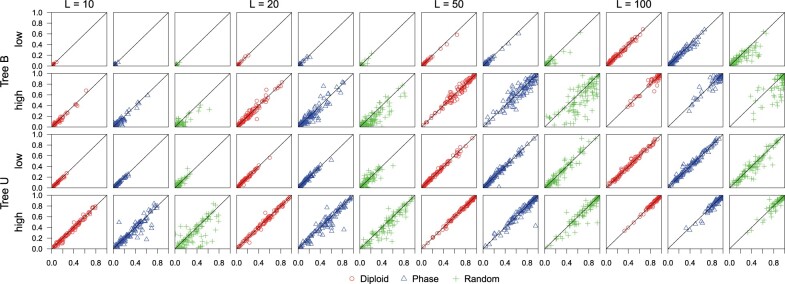
Figure 4.
(A01 under MSC, shallow tree,  ) Posterior
probability for the true species tree for phase-resolution strategies D (diploid), P
(PHASE), and R (random) plotted against the probability for strategy F (full data).
The data are simulated under the MSC models with species trees Shallow B and Shallow U
(Fig. 2a
 ,b
,b ), with
  sequences sampled per species. Each
plot has 100 scatter points, for the 100 replicate data sets, with the
 -axis to be the posterior
probability for strategy F while the
  -axis is for
strategies D, P, or R. “Low” (
 ) and
“high” (
 ) refer to the mutation
rate, and
  (= 10, 20, 50, 100) is the number
of loci. Results for other simulation settings are in Supplementary Figures
S1–S3 available on Dryad.

