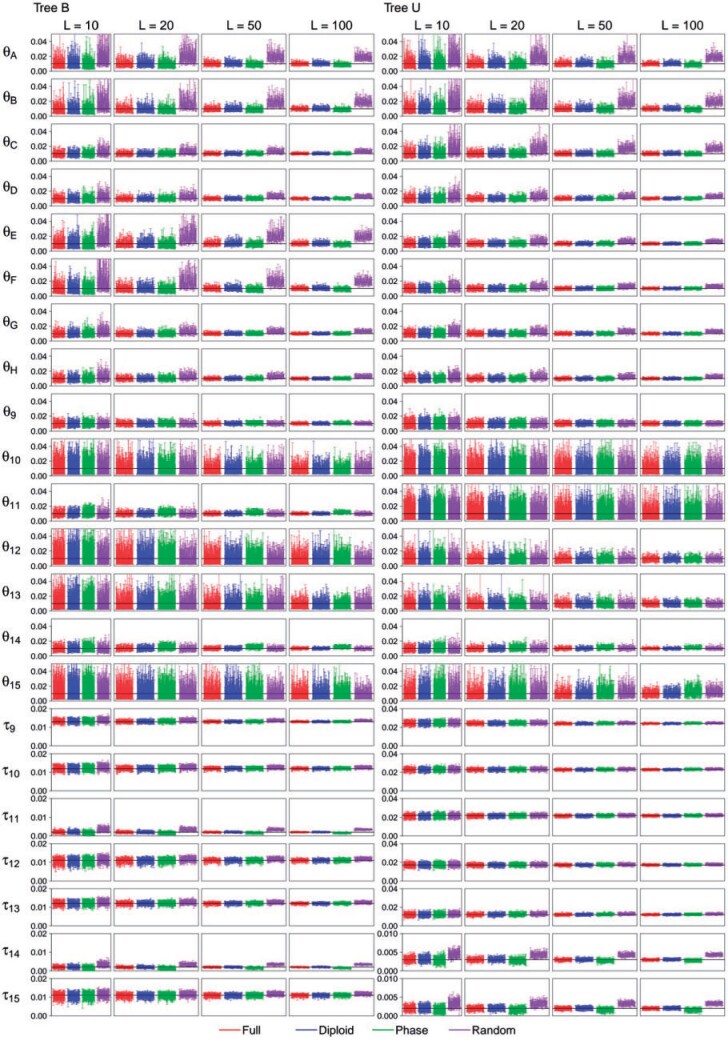
Figure 5.
(MSC, high rate, shallow,  ) The 95% HPD
CIs for parameters for four phase-resolution strategies: F (the full data), D
(diploid), P (PHASE), and R (random) in 100 replicate data sets simulated under MSC
model trees Shallow B and Shallow U (Fig.
2a
 ,b
,b ), at the high mutation rate
(
 ) and
) and
 sequences per species. The
horizontal black lines indicate the true values. Results for other simulation
settings are in Supplementary Figures
S5–S11 available on Dryad.

