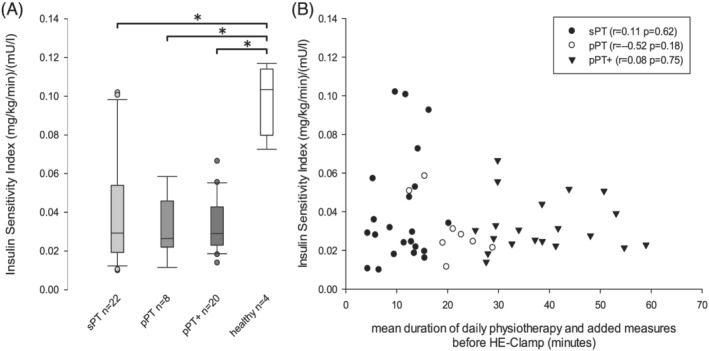
Figure 1.

Scatterplot insulin sensitivity and time of daily physiotherapy. (A) (left) Boxplot depicting insulin sensitivity index measured by hyperinsulinaemic euglycaemic (HE) clamp in physiotherapeutic groups and healthy control. (B) (right) Scatterplot showing insulin sensitivity index against dose of daily physiotherapy and added muscle activating measures (electrical muscle stimulation, vibration therapy) respectively in critically ill sepsis patients. ‘pPT’, protocol‐based physiotherapy; ‘pPT+’, protocol‐based physiotherapy with additional muscle activating measures; ‘sPT’, standard physiotherapy. Significant group differences are indicated by asterisk.
