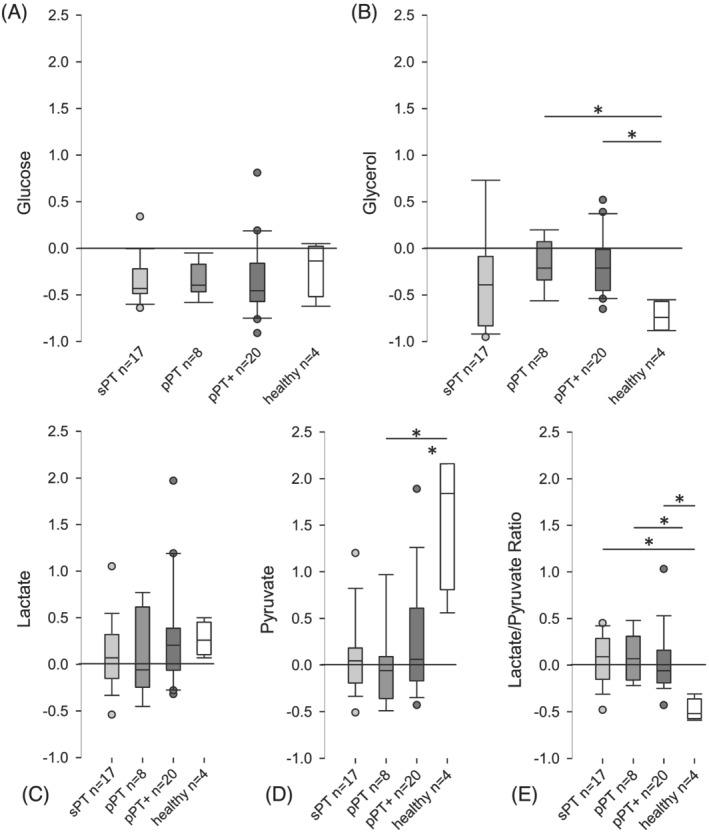
Figure 2.

Relative changes of muscle metabolite concentrations during hyperinsulinaemic euglycaemic clamp. Boxplots showing relative changes of dialysate concentrations [(A) glucose, (B) glycerol, (C) lactate, (D) pyruvate, (E) lactate/pyruvate ratio] obtained by microdialysis of the vastus lateralis muscle during hyperinsulinaemic euglycaemic clamp. Relative changes are defined as the difference of steady state and baseline concentration, in relation to baseline concentration. Reference line shown at relative change of 0, indicating neither increase nor decrease of concentration (e.g. relative change of −0.50 is equal to a decrease by 50%). Grouped by physiotherapeutic intervention. ‘pPT’, protocol‐based physiotherapy; ‘pPT+’, protocol‐based physiotherapy with additional muscle activating measures; ‘sPT’, standard physiotherapy. Significant differences are indicated with an asterisk; significance is unadjusted for multiple testing due to exploratory nature of the analysis.
