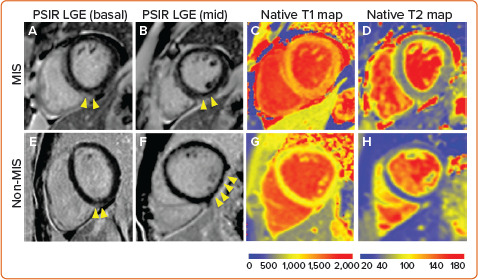
Figure 2: Cardiac Magnetic Resonance Features of COVID-19-related Myocarditis Comparing Multisystem Inflammatory Syndrome (MIS) versus Non-MIS Patients.

Top: A 25-year-old man who presented with MIS myocarditis who had elevated troponin I (peaked at 9 ng/ml) and non-specific ST-T changes. Cardiac magnetic resonance showed septal and inferior subepicardial LGE (A, B) and global elevation of T1 (1,245 ms, Z-score 15.6; C) and T2 values (63 ms, Z-score 11.2; D). Bottom: A 24-year-old man with non-MIS myocarditis who had post- COVID-19 dyspnoea on exertion. Cardiac magnetic resonance showed basal inferoseptal and mid-inferolateral LGE (E, F), normal global myocardial T1 (968 ms, Z-score 0.2; G) and mild regional T2 elevation (51 ms, Z-score 3.8) at the location of LGE (H). Yellow arrows point to the locations of LGE. The normal ranges of T1 and T2 were 930–1,010 ms and <50 ms, respectively. The normal range of Z-score was -2 to 2. LGE = late gadolinium enhancement; MIS = multisystem inflammatory syndrome; PSIR = phase sensitive inversion recovery.
