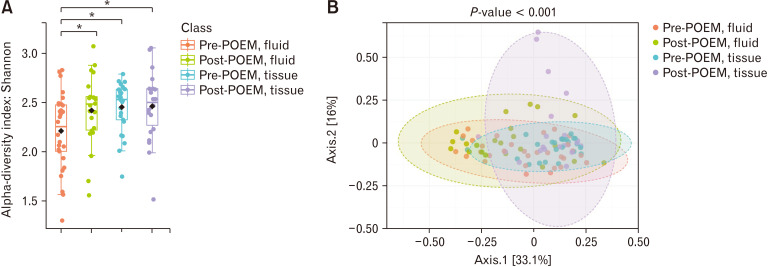
Figure 3.
Differences in alpha and beta diversity in esophageal microbiome (A) alpha diversity (Shannon index) and (B) beta diversity (Bray-Curtis index) The alpha diversity presented as Shannon index. Each dot represents an individual sample. Pink bars represent pre-peroral endoscopic myotomy (POEM), fluid; green bars represent post-POEM, fluid; blue bars represent pre-POEM, tissue; and purple bars represent post-POEM, tissue. Data are presented as box-and-whisker plots, with whiskers representing the lowest and highest values within 1.5*interquartile range (IQR). Black diamonds indicates the mean of Shannon index. *P < 0.05 as determined by two-way ANOVA followed by Tukey’s post hoc test.

