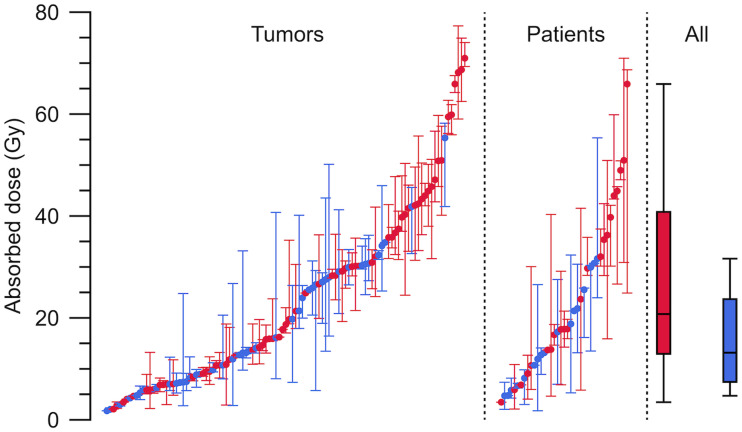
FIGURE 3.
Dispersion of AD per 7.4 GBq to tumors over cycles (left), within patients (middle), and between patients (right) for G1 NETs (red) and G2 NETs (blue). In tumor graph, dots represent median AD over cycles for each tumor, and whiskers are minimum and maximum AD. In patient graph, dots represent median AD of medians for tumors, and whiskers are minimum and maximum median AD. All-patients graph is box plot of median, first and third quartiles, and minimum and maximum of median ADs for patients.

