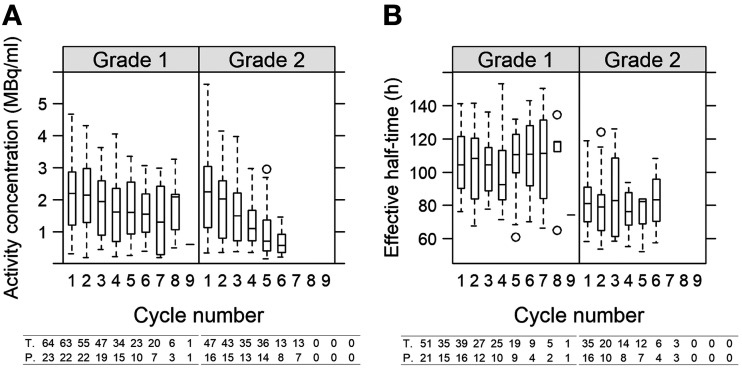
FIGURE 6.
Activity concentration (A) and effective half-time (B) as functions of cycle number for G1 and G2 NETs across all patients and all tumors. At bottom, numbers of tumors and patients are indicated beneath each box. For activity concentration in G1, 2 outliers at cycle 1 (6.8 and 7.5 MBq/mL) are excluded.

