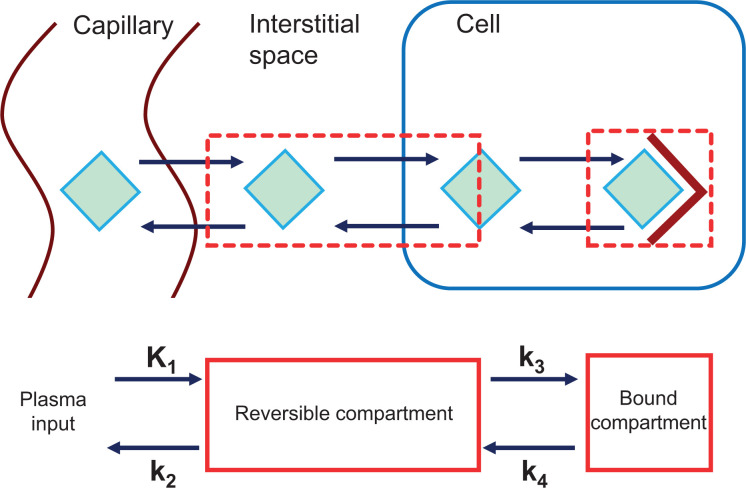
FIGURE 1.
(Top) Depiction of movement of tracer (green diamond) from vasculature to its intracellular tumor target (maroon V). Tracer is delivered to tumor via regional blood flow; travels from capillary, through interstitial space, and into cell, where it interacts with its target in this example; and may also follow reverse path. Static PET image represents summation of tracer in each of these steps in tissue. For kinetic analysis, compartments are constructed that represent key states of tracer (e.g., reversible compartment representing tracer in interstitial space and in cell, and bound compartment representing tracer engaging with target. Rate constants (K1, k2, k3, and k4) represent transfers between compartments (defined in Table 1), which may depict multiple tracers moving through multiple barriers.

