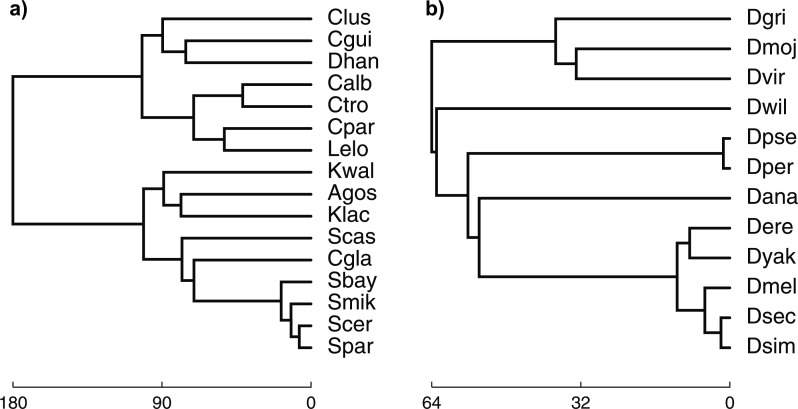
Figure 1.
The species trees reported in Rasmussen and Kellis (2012), which we use as the topologies in the simulations and in the empirical data analysis. a) The species tree of 16 fungal species. b) The species tree of 12 fly species. The species tree topologies and their branch lengths in units of million years are taken from http://compbio.mit.edu/dlcoal/.

