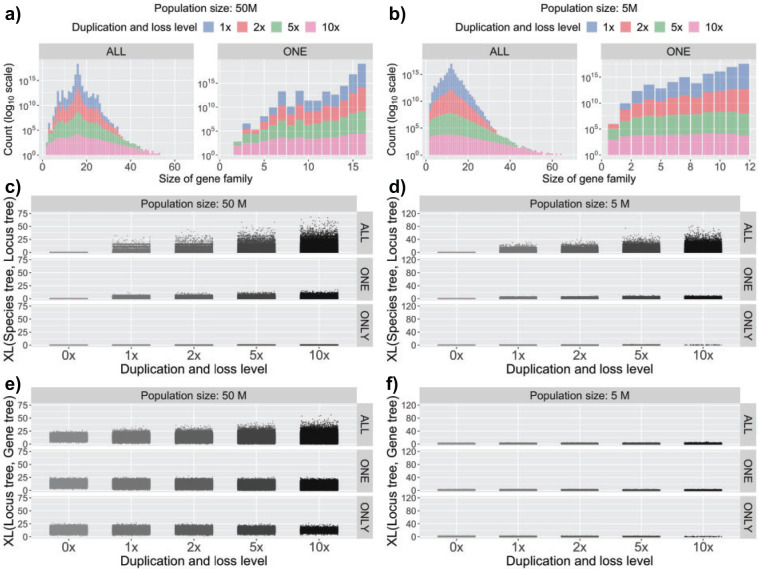
Figure 2.
Characteristics of the simulated data under different settings of the
duplication/loss rates and tree topologies. The duplication/loss rates
are denoted by the rate multiplier (0 ,
1
,
1 ,
2
,
2 ,
5
,
5 and
10
 ), where
1
 is the rate
found in nature for the clade represented by each species tree topology
(see Methods section). a,b) Distribution of the total number of gene
copies in individual gene families in the 16-taxon and 12-taxon data
sets, respectively. Note that the two tree topologies also have
different simulated effective population sizes in these figures (see
Supplementary
Fig. S1a,b available on Dryad for more conditions). c,d)
Scatter plots of XL (Species tree, Locus tree), the number of extra
lineages when reconciling the true locus trees with the true species
tree, for the 16-taxon and 12-taxon data sets, respectively. These plots
therefore represent the effects of GDL alone. e,f) Scatter plots of XL
(Locus tree, Gene tree), the number of extra lineages when reconciling
the true gene trees with the true locus tree, for the 16-taxon and
12-taxon data sets, respectively. These plots therefore represent the
effects of ILS alone, though note that higher rates of GDL allow there
to be more gene tree branches on which ILS can act.

