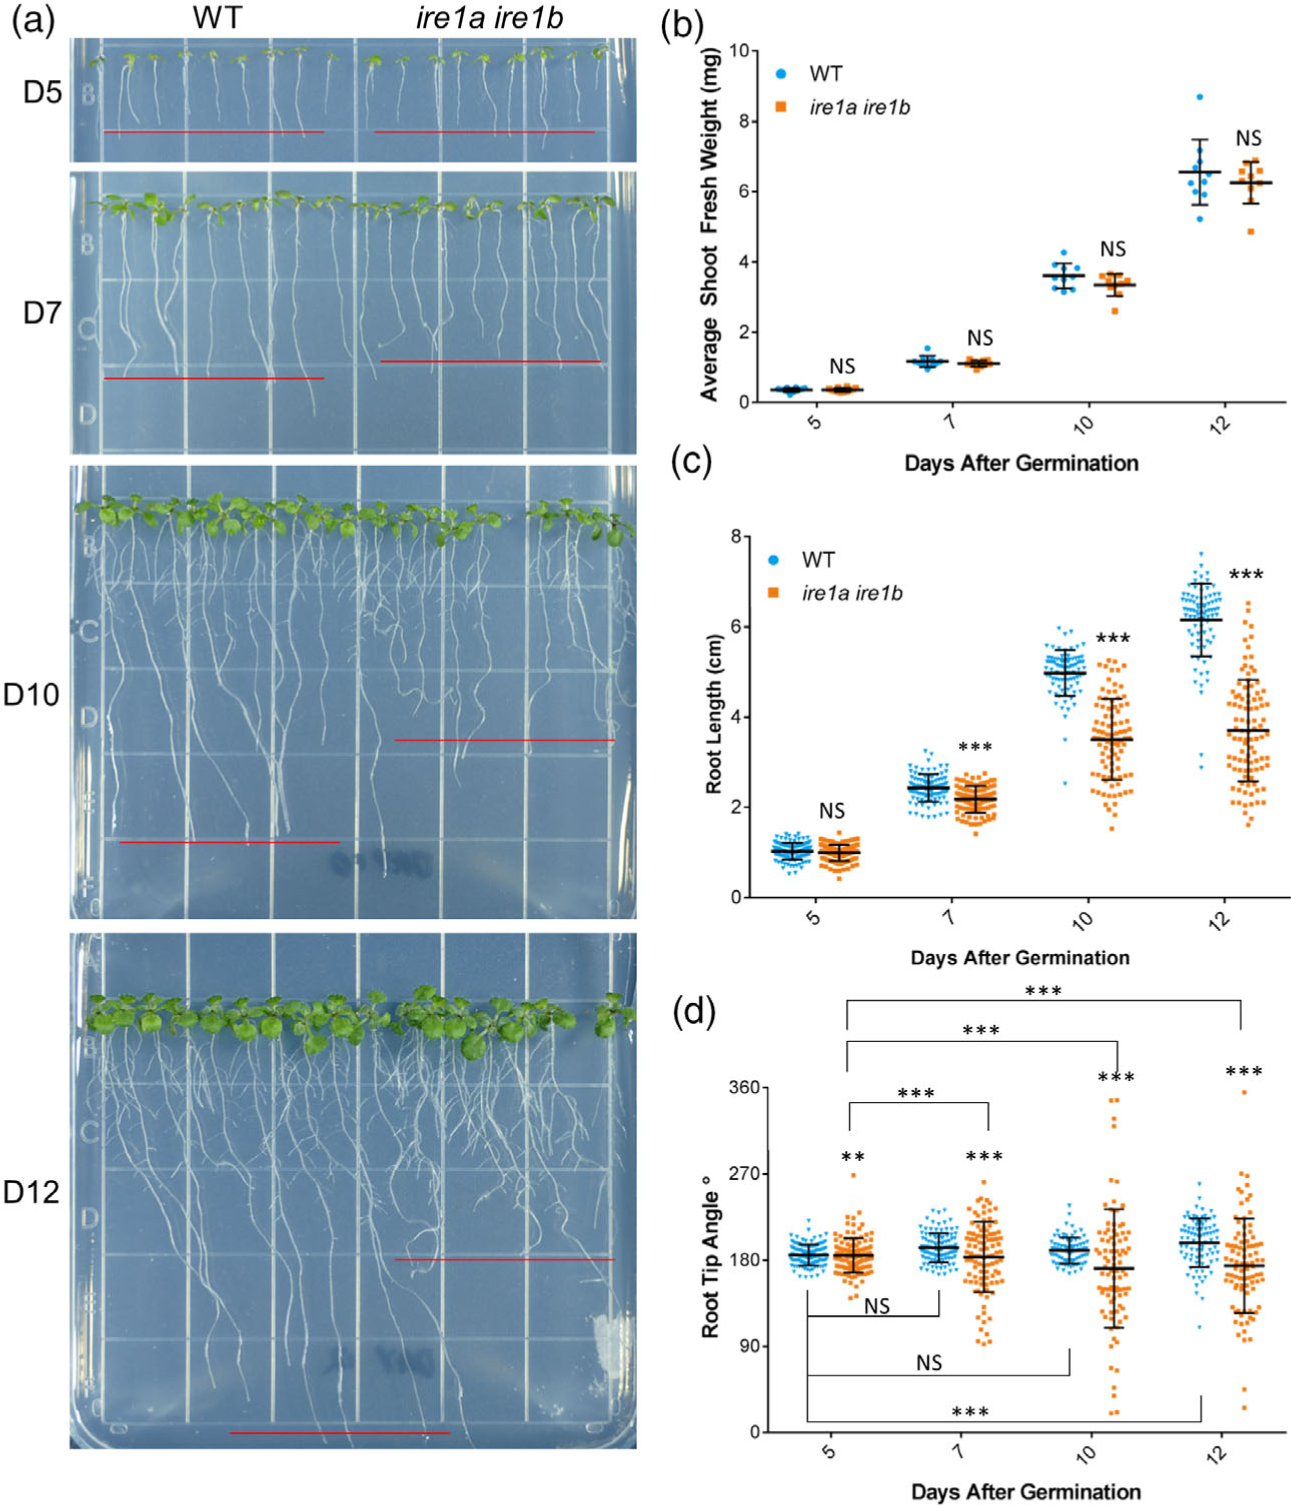
Figure 1.

The ire1a ire1b double mutant shows age-dependent primary root growth defects. (a) Representative images of WT and ire1a ire1b mutants grown for 5, 7, 10, or 12 days. Red lines represent approximate average root length of the displayed seedlings. (b) Shoot fresh weight was determined by averaging WT or ire1a ire1b shoots grown in an individual plate for each plate replicate (n = 10; error bars show the standard deviation). (c) The length of individual roots was measured using ImageJ. For Figure 1(b,c): error bars show the standard deviation; significance markers displayed above an ire1a ire1b experimental group are pairwise comparisons to the corresponding WT group for that specific treatment. Brackets denote other specific pairwise comparisons. Significance markers: NS = Padj > 0.01; *0.001 < Padj < 0.01; **0.0001 < Padj < 0.001; ***Padj < 0.0001. (d) The angle of the root tip with the vertical axis (0°) was measured using ImageJ. Significant differences between coefficients of variation were tested using the asymptotic Feltz and Miller test as described in the Experimental Procedures section. Error bars show the standard deviation; significance markers: NS = P > 0.0001; **P < 0.0001 and P > 1.0 × 10⁻¹⁰; ***P < 1.0 × 10⁻¹⁰
