
Figure 7.
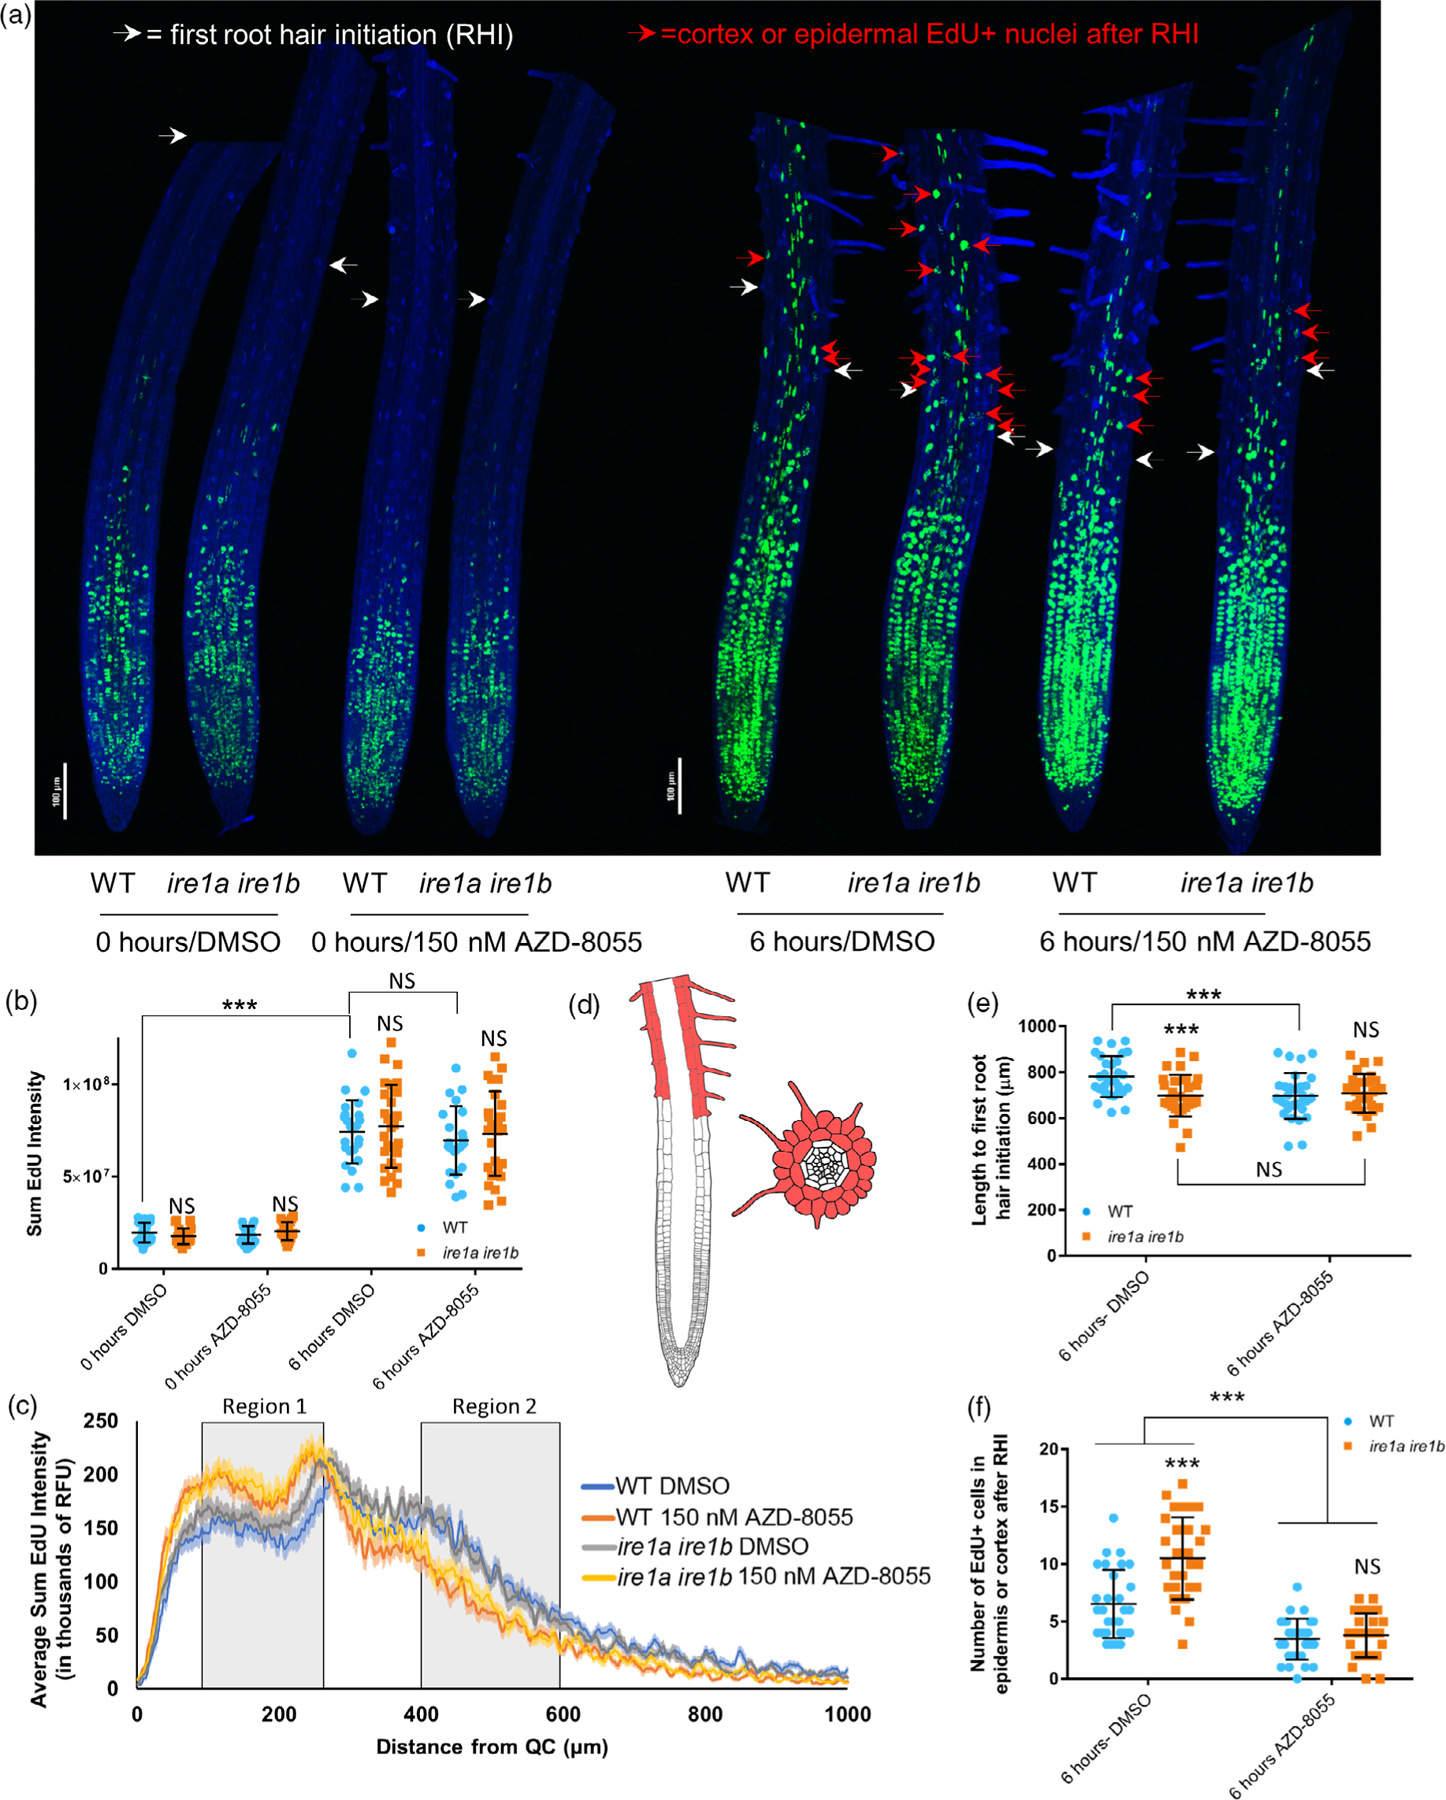
TOR hyperactivity in the Ire1a Ire1b mutant promotes differentiation rather than cellular proliferation. Seedlings grown for 7 days on media containing DMSO or AZD-8055 were treated briefly with EdU and immediately fixed (0 h) or returned to plates and allowed to grow for a further 6 h (6 h). See the Experimental Procedures section for full analysis methods. (a) Composite image compiled from representative 10× max projection images of root tips from all treatments. (b) Sum EdU intensity and (c) average EdU sum intensity along the root tip (6 h) was determined from max projection images of individual roots. (d) Diagrams of vertical and horizontal cross-sections of an Arabidopsis root tip highlighting the epidermal and cortex cell layers above the first RHI where EdU-positive nuclei were counted. (e) Length to the first RHI and (f) the number of differentiated EdU+ nuclei were determined for each root by manual assessment of Z-series images. For all graphs error bars show the standard deviation; significance markers displayed above an Ire1a Ire1b experimental group are pairwise comparisons to the corresponding WT group for that specific treatment. Brackets denote other specific pairwise comparisons. Significance markers: NS = Padj > 0.01; *0.001 < Padj < 0.01; **0.0001 < Padj < 0.001; ***Padj < 0.0001.