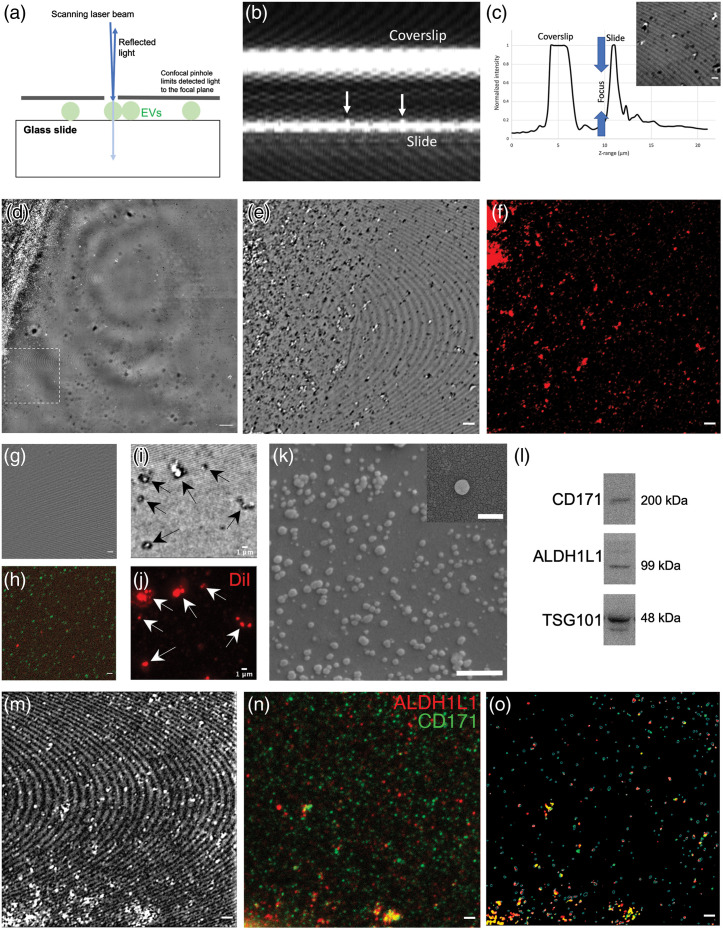
Fig. 2.
(a) Diagram demonstrating the reflectance signals that originate from the laser-scanning of EVs fixed on a glass slide. (b) Orthogonal plane image of a -stack of reflectance images indicating the highly reflective coverslip and surface of the glass slide; these are cues that can aid in finding the focal plane of EVs. Arrows indicate punctate reflectance signals from EVs on top of the glass slide. (c) Normalized signal profile of the reflectance signals, illustrating the peaks of highly reflective glass surfaces. Imaging focus was adjusted to slightly above the upper surface of the slide (d) Wide-field confocal reflectance image of the EV sample shows the thick aggregate that forms at the boundary of the drop and smaller aggregates closer to the center. Dotted square indicates the imaging field in (e) and (f). Scalebar: . (e) Close-up view of the boxed zone in (d) shows bright reflection signals from EVs and their clusters. Scale bars: (f) immunolabeled EVs for L1CAM indicate their neuronal origin. (g) and (h) PBS control had no reflection signals but had punctate nonspecific fluorescence signals suggesting free unbound antibody complexes or autofluorescent elements. Scale bars: . (i) and (j) Staining of the high-intensity reflectance particles with DiI (a lipophilic dye), indicating that they are membranous particles. Scale bars: . (k) SEM images of the EVs derived from mouse brain cortices (scale bar: 500 nm), and a high magnification image of a single EV from the same sample (inset, scale bar: 200 nm). (l) Representative immunoblot images of L1CAM (CD171), ALDH1L1, and TSG101 proteins in brain-derived EV sample. (m)–(o) Reflection signals were used to select fluorescence signals originating from reflection-positive EVs and to mask all other nonspecific signals. It is noteworthy that not all EVs are labeled with either ALDH1L1 or L1CAM, suggesting that they are not of astrocytic or neuronal origin. Scale bars: .

