Figure 3.
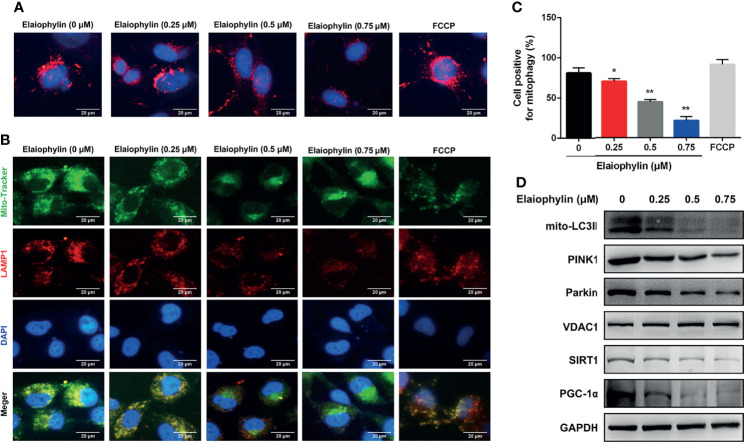
Elaiophylin inhibits mitophagy in C918 cells. (A) C918 cells overexpressing Mito-Keima plasmid was treated with Elaiophylin for 24 h. Mito-Keima (red fluorescence) was detected by a fluorescence microscope. FCCP, a mitophagy agonist, was used as positive control. (B) Colocalization of mitochondria and lysosomes. Mitochondria were stained with MitoTracker Green (200 nM), and lysosomes were stained with LAMP1 (red fluorescence). The representative images of fluorescent labeling were shown here. (C) Quantitative analysis of cellular mitophagy of (B) was conducted with Image J software. Five different visual fields of each group were selected for measurement. (D) Western blotting was performed to analyze the expression of proteins related to mitophagy. GAPDH and VDAC1 were used as loading controls for cytoplasm and mitochondria, respectively. Data was expressed as mean ± SD of three experiments. * p<0.05, ** p<0.01 vs. control.

