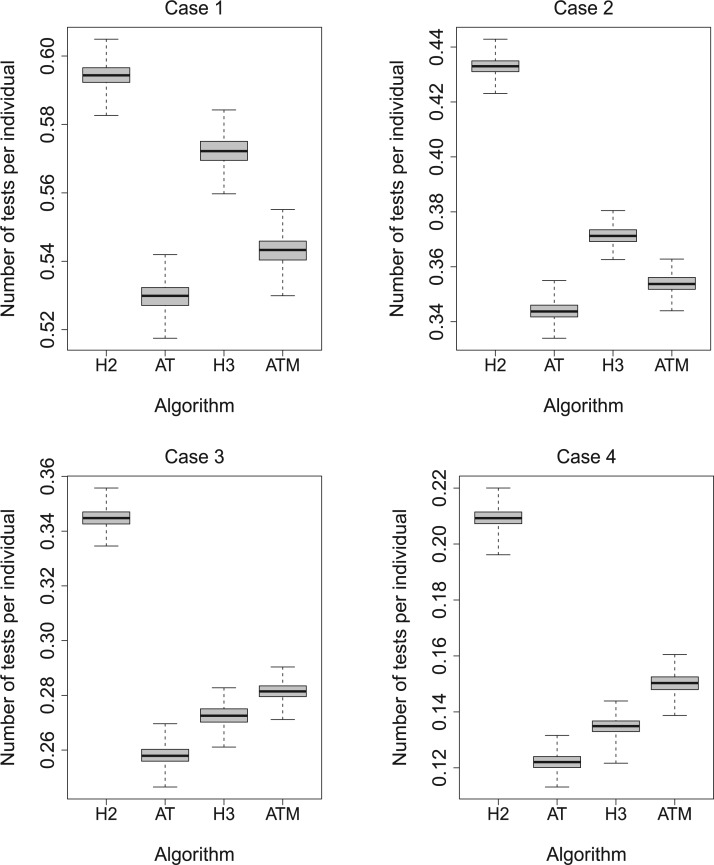
Fig. 2.
Simulation study for Cases 1–4 in Table 1. Boxplots of the number of tests per
individual using  Monte Carlo data sets. Array and
hierarchical group sizes are the same as those in Table 1. The same figure for Cases 5–8
in Table 1 is in the supplementary
material available at Biostatistics online.

