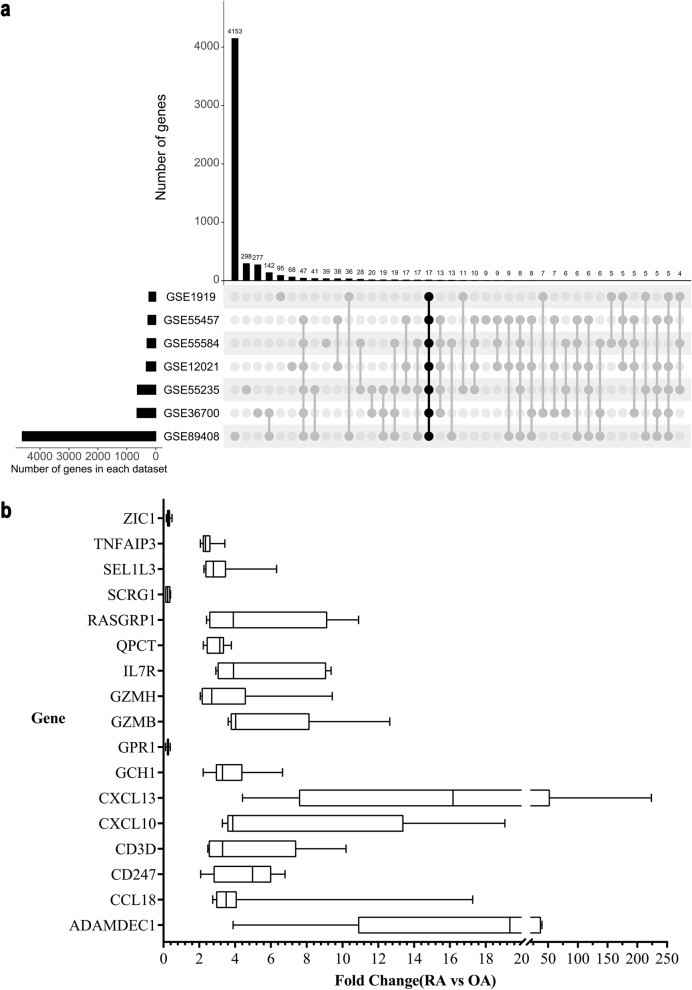
Fig. 1.
Identification of 17 DEGs between RA and OA. a Histogram indicating the number of overlapping DEGs expressed between RA and OA tissues. The bar chart above shows the DEGs between RA and OA in each type of intersection. The dotted line at the bottom right shows the types of events included in each type of intersection. 17 DEGs were identified in seven transcription profile datasets (GSE55235, GSE55457, GSE55584, GSE1919, GSE36700, GSE12021, and GSE89408) using package UpSetR. b A chart of 17 genes expressed differentially between RA and OA from all datasets (P < 0.05)

