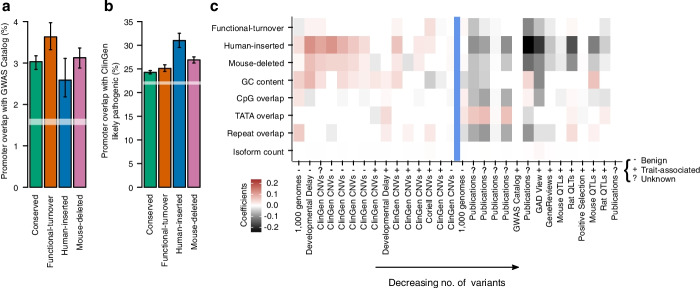
Fig. 6.
Human-specific promoters are particularly enriched for phenotype-associated structural variants. Percentage of promoters of different evolutionary histories overlapping phenotype-associated variants from the GWAS Catalog (a) and likely pathogenic variants from ClinGen (b). Error bars represent the 95% confidence interval from 1000 samplings of the data with replacement. The dashed white lines represent the same confidence interval for genome-wide permuted promoter positions. Dashed black lines show the same confidence interval for the overlap of the same variant class (SNPs and structural variants, respectively in a and b) for all variants in the 1000 genomes database (see Fig. 1). c Heatmap of beta-coefficients from multivariate regression considering evolutionary history and additional promoter and gene features (y axis). Genetic variant collections (x axis) were extracted from the ‘Phenotype and Literature’ dataset group from the UCSC Genome Browser and are marked as ‘benign’, ‘trait-associated’ or ‘unknown’ using each table description. Red denotes QTL enrichment relative to conserved promoters and grey depletion. Non-significant (p > 0.05) associations have beta rounded to zero (displayed as white)

