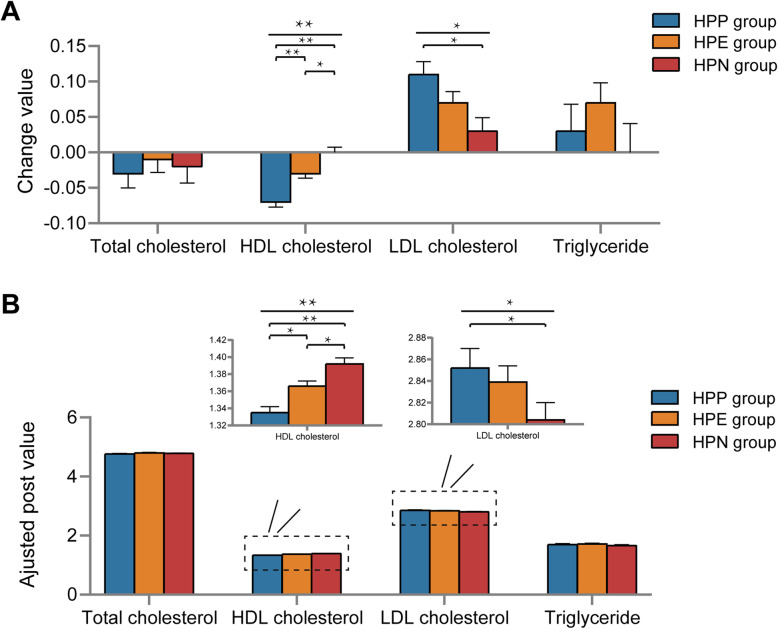
Fig. 2.
Changes in lipid metabolism parameters between the 2 examination points in the HPP, HPE, and HPN groups. A. Bar plots comparing the change values (calculated as the difference between the 2 examinations) among the 3 groups. The error bar represents the standard deviation. B. Bar plots showing comparisons of adjusted post values among the 3 groups. The adjusted post value was presented as the estimated marginal means of the lipid metabolism parameters in the second examination adjusted for the first examination’s outcomes. The error bar represents the standard deviation. HPP, persistently positive H. pylori; HPE, H. pylori eradication; HPN, persistently negative H. pylori; HDL, high-density lipoprotein cholesterol; LDL, low-density lipoprotein cholesterol

