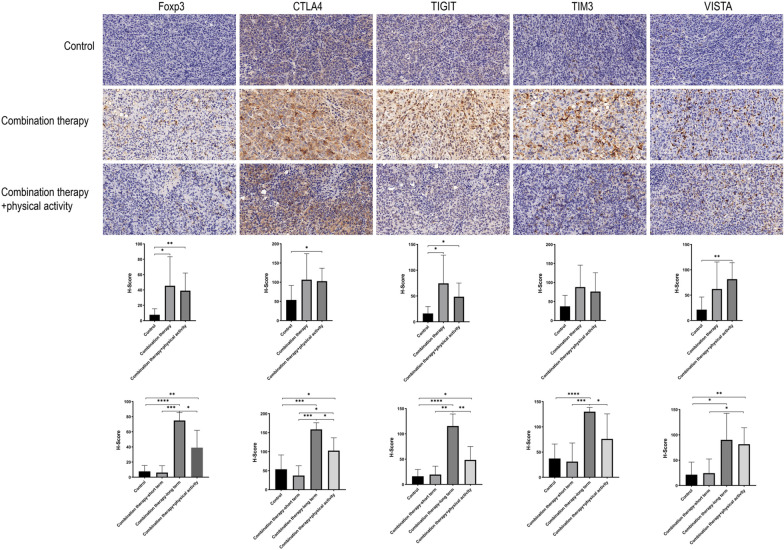
Fig. 3.
Immunohistochemical staining and analysis of subcutaneous tumors. Immunohistochemical staining was conducted on subcutaneous tumor tissue microarray. H-score were calculated to quantify the expression levels of marker proteins. Representative images captured at 40 ×. *P < 0.05, **P < 0.01, ***P < 0.001, ****P < 0.0001. Foxp3 forkhead box protein p3, CTLA4 cytotoxic T-lymphocyte-associated protein 4, TIGIT T cell immunoreceptor with Ig and ITIM domains, TIM3 T-cell immunoglobulin mucin-3, VISTA V domain-containing Ig suppressor of T-cell activation

