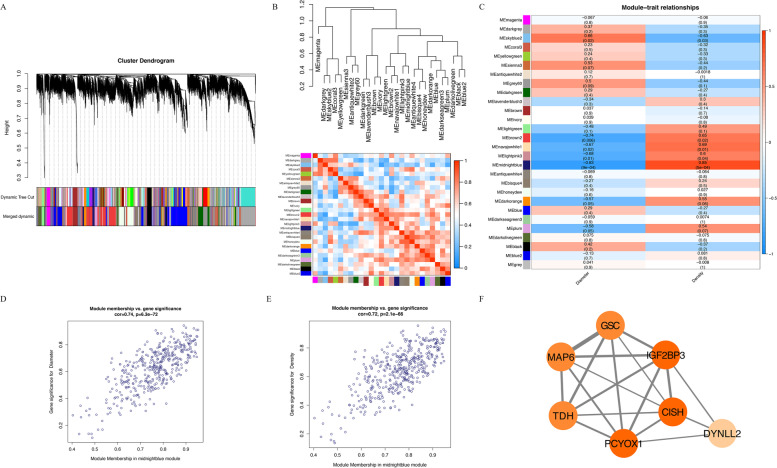
Fig. 1.
WGCNA analysis of gene expression profile with muscle fiber and diameter in Gushi chicken breast muscle tissue at 6, 14, 22, and 30 weeks. A The cluster dendrogram constructs the gene modules and module merging. B Correlation analysis between the modules. C Analysis of the correlation between different module genes and phenotypes. D GS and MM analysis for diameter. E GS and MM analysis for density. F The connection network of the 7 hub genes in the midnight blue modules (the thickness of the line between them represents the weight value between them, and the depth of the color of the node represents the number of connected nodes)

