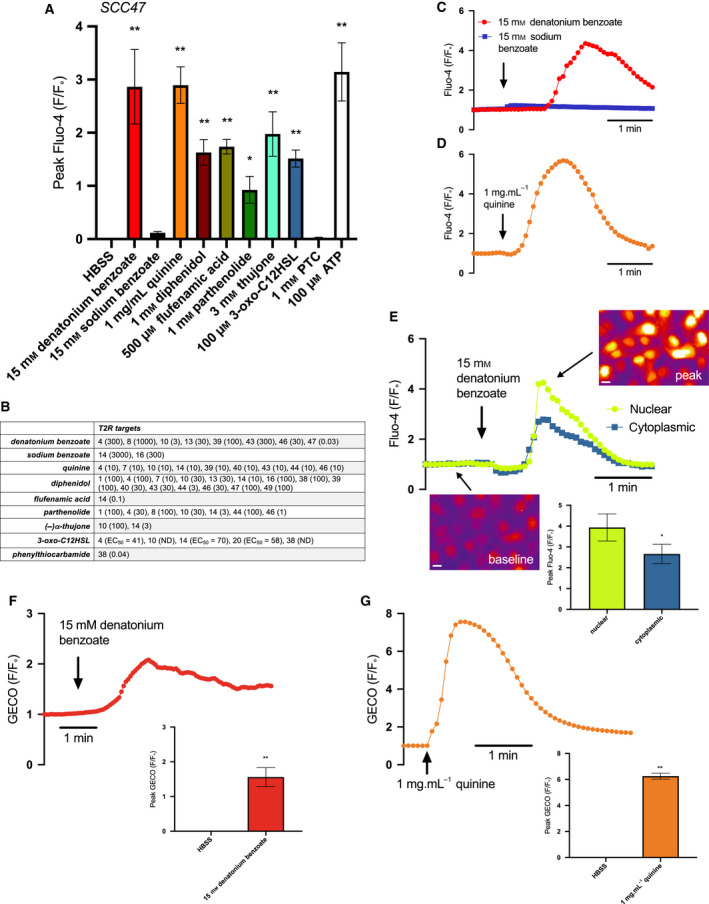
Fig. 4.

Bitter (T2R) agonists activate Ca2+ i responses in cultured HNSCC. HNSCC cell line SCC47 loaded with Ca2+ binding dye, Fluo‐4, was stimulated with T2R agonists, and Ca2+ was measured over time. (A) Peak Fluo‐4 F/Fo was quantified after stimulation with Hank's Balanced Salt Solution (HBSS), denatonium benzoate, sodium benzoate, quinine, diphenidol, flufenamic acid, parthenolide, thujone, 3‐oxo‐C12HSL, phenylthiocarbamide (PTC), and purinergic receptor agonist adenosine triphosphate (ATP) (mean ± SEM; 3 experiments using separate cultures). Significance by 1‐way ANOVA with Bonferroni posttest comparing HBSS to each agonist. (B) Table of T2R targets for agonists used. Effective concentration (EC, in µm) or half‐maximal effective concentration (EC50, when indicated) shown in parentheses, taken from [40, 50]. Compounds with ‘ND’ denote EC not determined. (C, D) Representative traces of Fluo‐4 F/Fo over time after stimulation with denatonium benzoate (C) and sodium benzoate (separate traces superimposed) and quinine (D). Traces are from n = 1 culture each but are representative of results obtained from 3 independent cultures (mean ± SEM shown in A). (E) Fluo‐4 fluorescence in response to denatonium benzoate‐induced Ca2+ release appears to localize more strongly to the nucleus than the cytoplasm as represented by the traces and images; peak Fluo‐4 F/Fo for nuclear Ca2+ release is significantly greater than cytoplasmic Ca2+ release (mean ± SEM; 3 separate cultures). Significance by unpaired t‐test. Scale bar is 10 µm. (F, G) Nuclear‐localized R‐GECO‐nls was used to measure nuclear Ca2+ after stimulation with (F) denatonium benzoate and (G) quinine. Both agonists stimulate nuclear Ca2+ as demonstrated by the traces over time and peak GECO F/Fo compared to HBSS (mean ± SEM; 3 separate cultures). Significance by unpaired t‐test. *P < 0.05; **P < 0.01.
