Fig. 5.

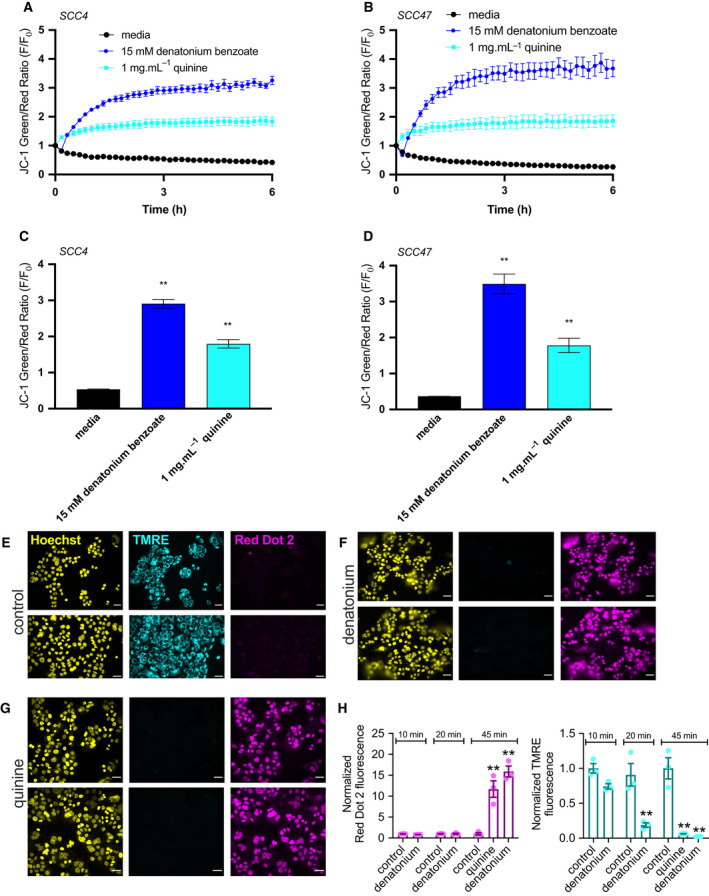
Bitter (T2R) agonists cause mitochondrial depolarization of HNSCC. JC‐1 dye, an indicator of ΔΨm, shows higher green/red signal with depolarized mitochondria. (A–D) SCC cell lines loaded with JC‐1 were stimulated with T2R agonists. Representative traces over 6 h for HNSCC cell lines SCC4 (A) and SCC47 (B) after stimulation with media, denatonium benzoate, and quinine demonstrate mitochondrial depolarization with bitter agonists (mean ± SEM; 3 separate cultures for each cell line). JC‐1 green/red ratio was quantified for SCC4 (C) and SCC47 (D) at 3 h showing significantly higher ratios for denatonium benzoate and quinine compared with media (mean ± SEM; 3 separate cultures for each cell line). Significance by 1‐way ANOVA with Bonferroni posttest comparing media to each agonist. (E–H) SCC4 was treated with media (E), denatonium benzoate (F), and quinine (G) for 45 min then stained with Hoechst (nuclei), TMRE (mitochondria with intact membrane potential), and Red Dot 2 (indicates permeable plasma membrane) dyes. Scale bars in E–G are 20 µm. (H) TMRE and Red Dot 2 fluorescence intensities were separately compared between media, denatonium benzoate, and quinine, demonstrating mitochondrial depolarization and plasma membrane permeability after bitter agonist stimulation (mean ± SEM; 3 separate cultures). Significance by 1‐way ANOVA with Dunnett’s posttest comparing media to each agonist. **P < 0.01.
