Fig. 3.

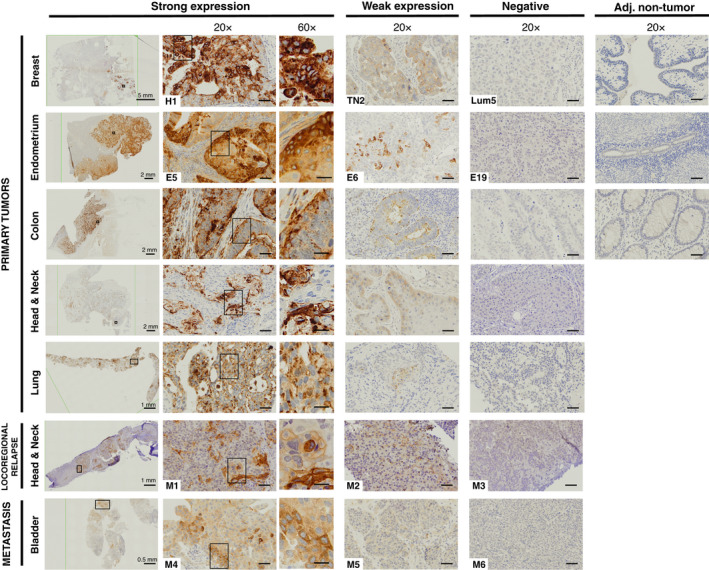
HEMO protein is detected in various tumor tissues. Examples are shown of strong, weak, and absent HEMO expression in cancer samples and of no detection in adjacent non‐tumor samples (staining with anti‐HEMO 2F7 mAb). Left column (0.4–2×): scale bar indicated in mm, black frame defined localization of 20× view. 20× columns: scale bars correspond to 50 μm, black frame defined localization of 60× view. 60× column: scale bars correspond to 20 μm. Numbers displayed on breast (H1, TN2, Lum5) and endometrium (E5, E6, E19) samples correspond to numbers used in Fig. 4. Numbers displayed on locoregional relapse samples and metastatic samples (MOSCATO M1 to M6) correspond to those marked in red in Fig. 2.
