Fig. 5.

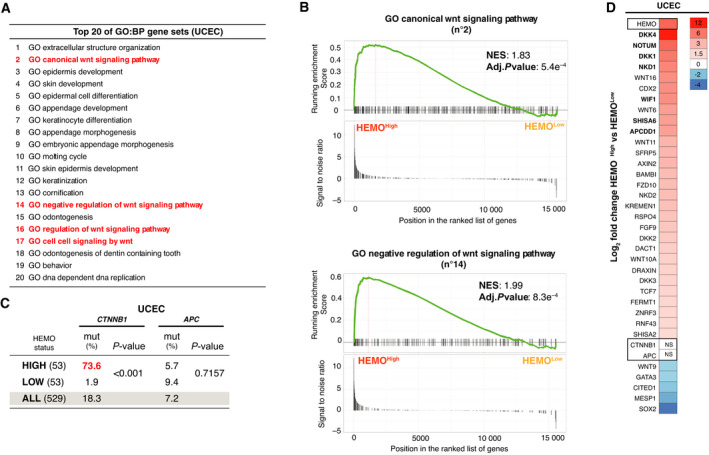
HEMO upregulation is associated with an active Wnt/β‐catenin pathway in UCEC cohort. (A) Top 20 GO (Gene Ontology) BP (Biological Process) gene sets with the highest significance in UCEC cohort, extracted from Table S7. In red: Wnt signaling pathways. (B) GSEA enrichment plots showing ‘GO canonical Wnt signaling pathway’ and ‘GO negative regulation of Wnt signaling pathway’ enriched signatures between UCEC HEMOHigh vs HEMOLow tumors. NES: Normalized Enrichment Score. (C) Mutational status of CTNNB1 and APC in UCEC HEMOHigh and HEMOLow tumors, 53 cases of each (P‐value, Fisher's exact test). For comparison, mutational status of the total UCEC cohort is indicated. (D) Heatmap for the significant Wnt‐related genes differentially expressed between HEMOHigh and HEMOLow tumors. Color gradation is representative of Log2 fold change. The differential level of HEMO expression is also indicated at the top of the heatmap (LogFC = 7). For all depicted genes, adjusted P‐value is < 0.01 (except for APC and CTNNB1, NS: nonsignificant). In bold, common upregulated genes found in COAD cohort (Fig. S4B).
